
 Home
Home News
News
- 1 ANKR’s price is currently trading at $0.02013 with a 54.61% fall in the 7-day trading volume.
- 2 ANKR observed a decline of 0.54% in the last week.
The ANKR token price recently faced a bearish breakdown through a crucial support zone. The price of the token is currently moving within a consolidation channel which indicates that there is an exhaustion in selling pressure. After making an M pattern near $0.0400, the price shattered its market structure. It is currently seeing a decline of 55% within the last 8 weeks.
The technical indicators are presenting a contrasting view regarding future trends on a daily timeframe. Presently, the value of the token is below all the 20,50,100 and 200 key averages. Both of the Oscillators are moving in the oversold levels.
The price of the ANKR token has been attempting to breach its crucial resistance levels, which implies that the bulls are ready to break out of the bears’ significant hold over them. The value of the ANKR coin is currently $0.020, and its Market Cap is around $201.25 million.
Investors’ Total Bullish and Bearish Sentiments
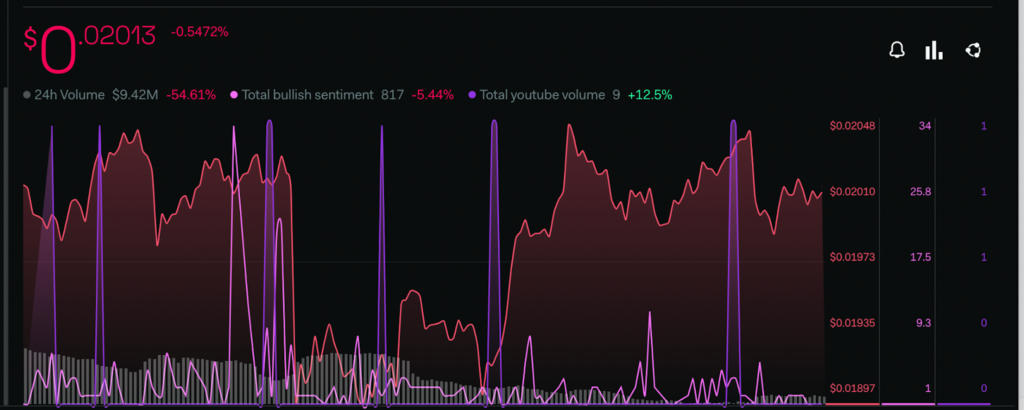
Investors’ sentiments regarding the ANKR token seem to be negative at present. The total bullish sentiment metrics have declined by 5.44% whereas the Social Engagement metrics have also observed a slight fall of 0.8%, according to LunarCrush.
The majority of overall parameters are highlighted in red across the LunarCrush platform. However, the Youtube volume has increased by 12%, presenting an exception to the rule.
In the previous analysis, it was observed that the majority of technical indicators regarding the ANKR token were bearish despite the positive price action and RSI was against the recovery.
The price created a bearish double-bottom pattern after a red engulfing candle where it lost 30% of its overall value.
Technical Analysis of ANKR
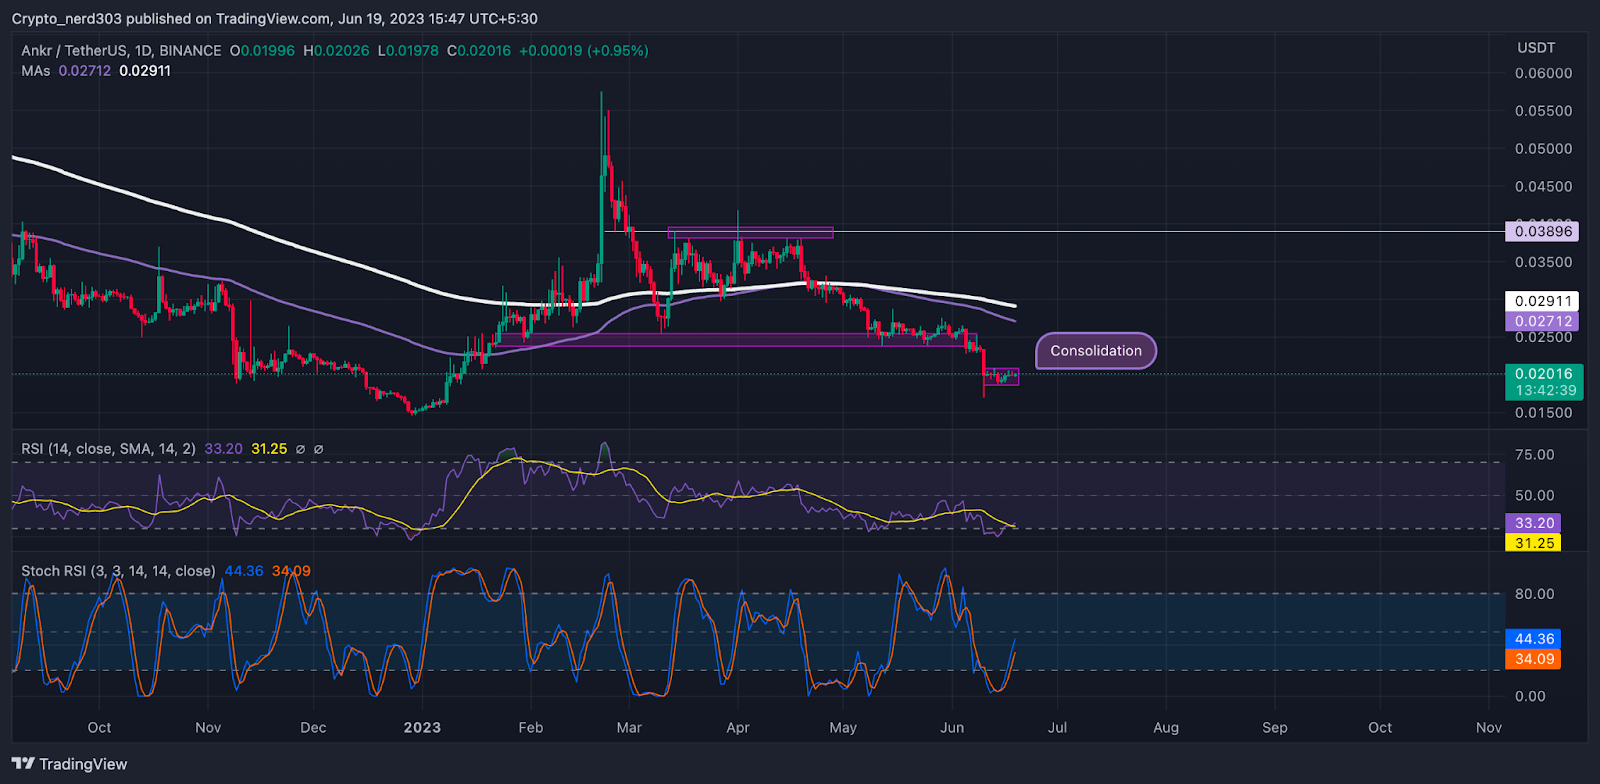
The RSI line is presently facing resistance from the 14-day SMA. Making a positive recovery is more probable because the RSI is undervalued. As of now, the value of the RSI line is 33.20 points, above the 14-day SMA which is at 31.25.
Presently, the stochastic RSI is following the RSI line closely. The current value of stochastic RSI is 44.36 points. The %K and %D lines are making a positive rebound from the demand zone.
Conclusion
As per the analysis, ANKR price is moving beneath essential EMA and SMA levels in the daily time frame, indicating a bearish trend. The RSI and Stochastic RSI line is implying that the price may attempt to make a bullish recovery.
Technical levels –
Support -$0.01500
Resistance – $0.02500 and $0.03000
Disclaimer
The views and opinions stated by the author, or any people named in this article, are for informational purposes only, and they do not establish financial, investment, or other advice. Investing in or trading crypto assets comes with a risk of financial loss.

Andrew is a blockchain developer who developed his interest in cryptocurrencies while pursuing his post-graduation major in blockchain development. He is a keen observer of details and shares his passion for writing, along with coding. His backend knowledge about blockchain helps him give a unique perspective to his writing skills, and a reliable craft at explaining the concepts such as blockchain programming, languages and token minting. He also frequently shares technical details and performance indicators of ICOs and IDOs.


