
 Home
Home News
News
- 1 The LINK price is currently trading at $5.213 while seeing a change of -31.7% in 24-hour trading volume.
- 2 The LINK price is observing a decrease of 0.69% in the last 24 hours.
Chainlink platform is a decentralized network which links smart contracts on blockchains to real-world data. The network is composed of diverse nodes or oracles which are liable for collecting and validating the data. It permits smart contracts to access off-chain data like stock prices or weather by providing a safe and reliable link in between.
The LINK price is presently breaking out of its band with an exceedingly bearish red candle. The price is moving just below its support level of range seeing a bearish decline where the red engulfing candle itself was around 20%. It will require substantial support from the buyers in order to resume its previous trend.

Stangency in Revenue and Fees of LINK Token
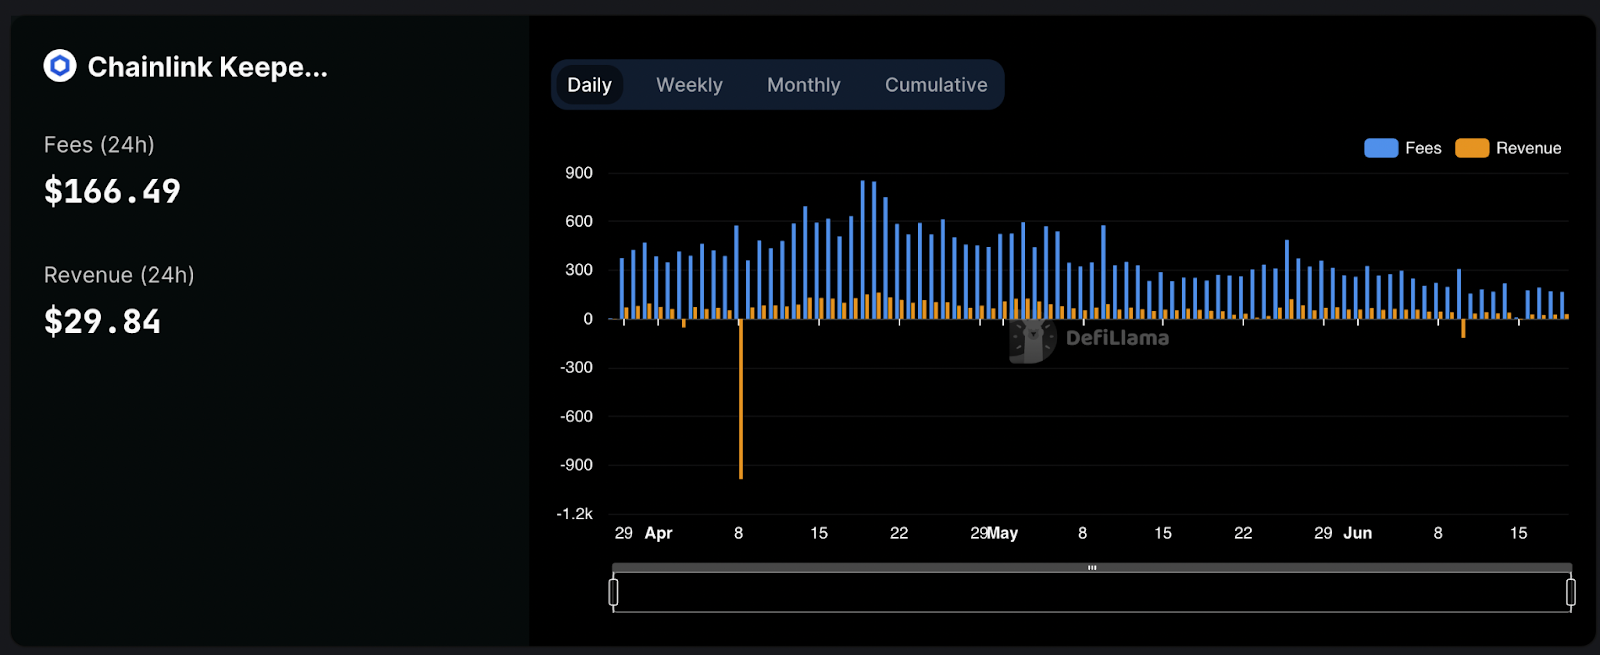
After facing stagnancy in Fees and Revenue of the LINK price for the past few months, its value has depreciated slightly. The number of developers on the network has increased since the start of the year.
Sentiments Index of Overall Market
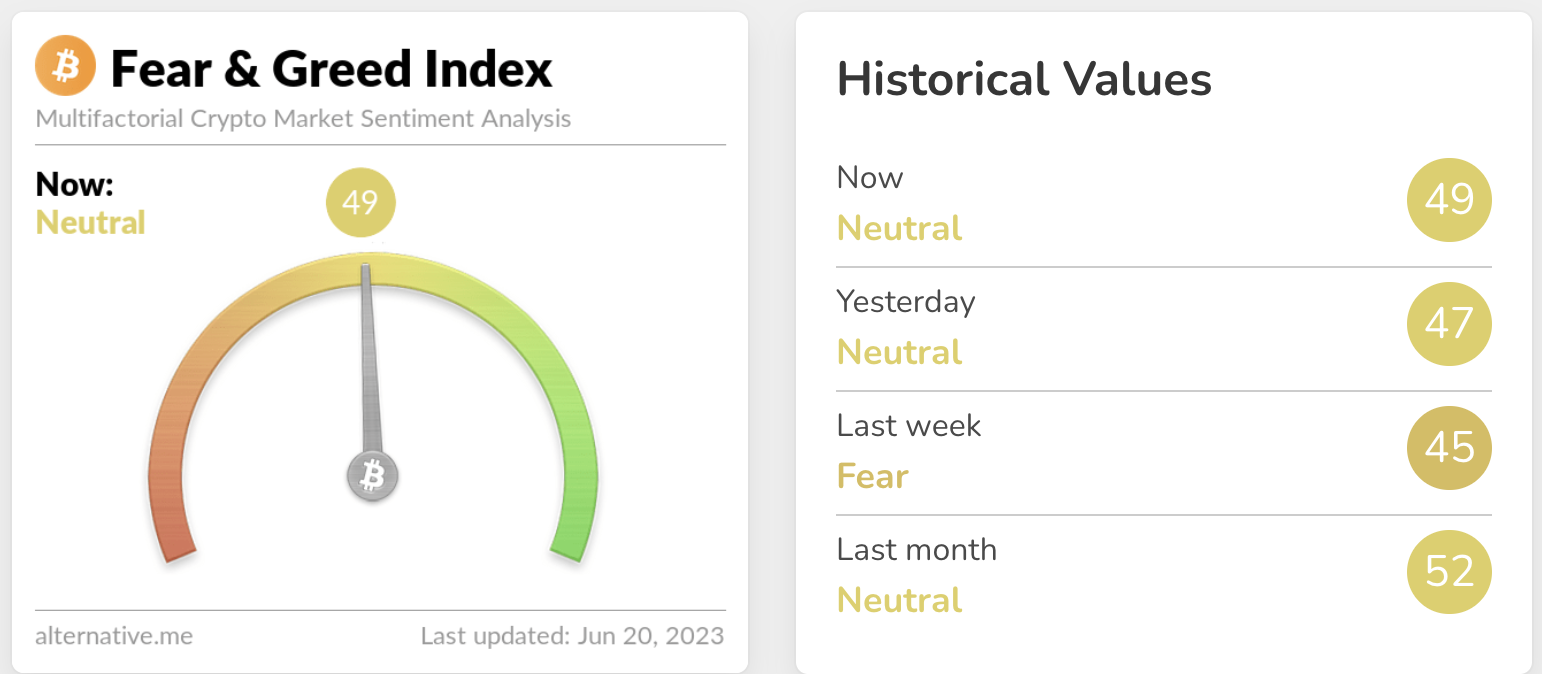
Market sentiments have been in the neutral zone for the past few weeks but at the moment, they are taking a decline in value, falling into the fear zone. The present value of market sentiment in the sentiment index is 49 points, according to the greed and fear index. A stagnancy was recorded in these values over the previous few months.
Technical Analysis of LINK Token in Daily Time Frame
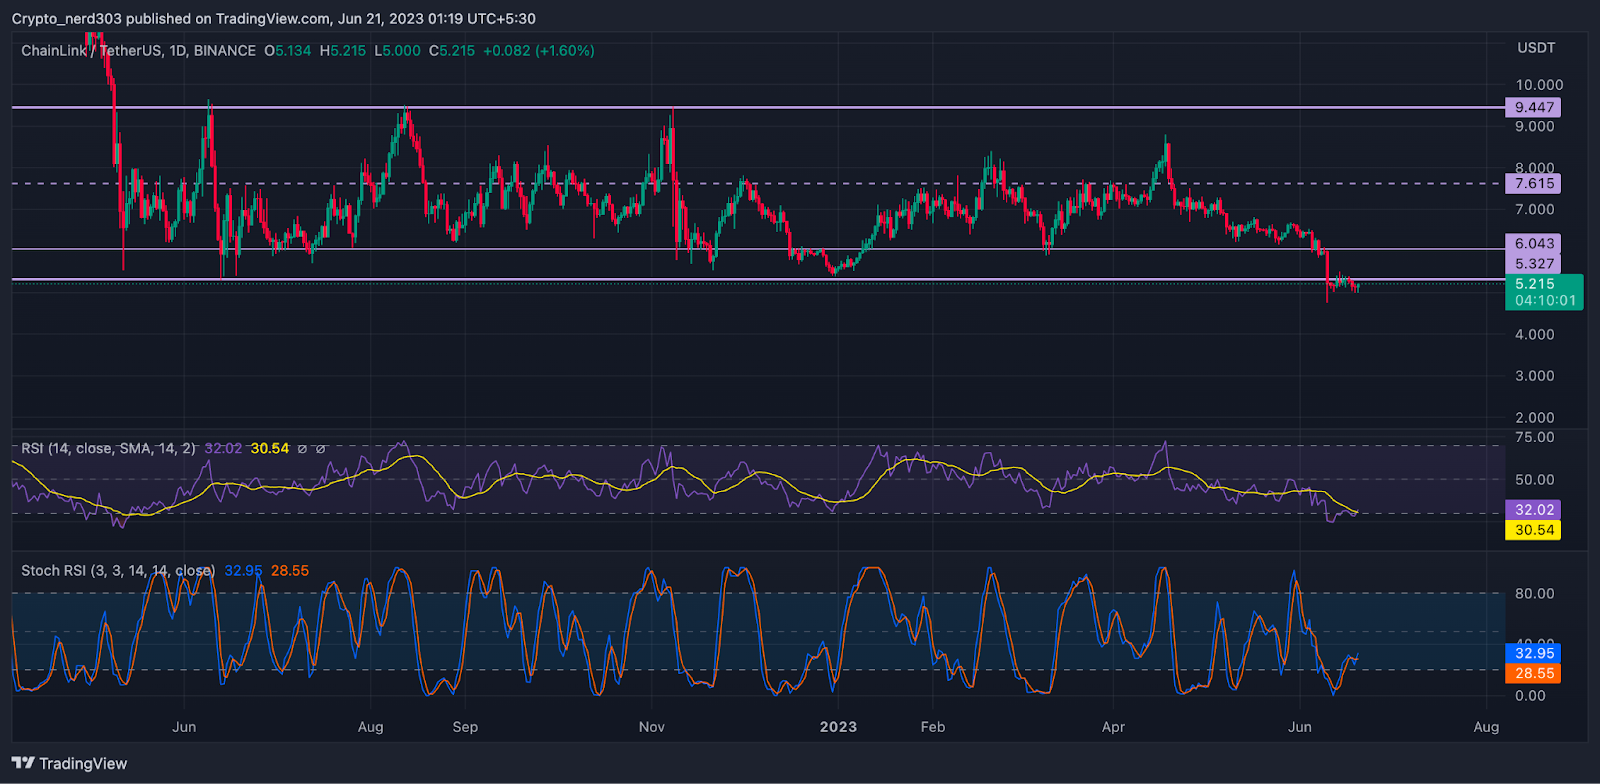
The RSI line is presently moving near oversold levels of around 30 points. The value of the RSI line as of now is 32.02 points, while the 14 SMA is giving resistance to it at around 30.54 points.
The stochastic RSI made a positive crossover past the median line. The %D line recently intercepted the %K line above 20 points. The stochastic RSI suggests that the price of LINK may attempt to resume its bullish trend in recent days. The %K and %D lines have already started moving toward the overbought zone.
Conclusion
The technical oscillators are favouring the bulls of LINK token. Though EMA lines are providing strong resistance to the price while the oscillators are reaching the supply zone.
Technical levels –
Support –$4.000 and $3.000
Resistance – $7.000 and $8.000
Disclaimer
The views and opinions stated by the author, or any people named in this article, are for informational purposes only, and they do not establish financial, investment, or other advice. Investing in or trading crypto assets comes with a risk of financial loss.

Andrew is a blockchain developer who developed his interest in cryptocurrencies while pursuing his post-graduation major in blockchain development. He is a keen observer of details and shares his passion for writing, along with coding. His backend knowledge about blockchain helps him give a unique perspective to his writing skills, and a reliable craft at explaining the concepts such as blockchain programming, languages and token minting. He also frequently shares technical details and performance indicators of ICOs and IDOs.


