
 Home
Home News
News
- 1 XOM stock shows a bearish outlook in the last trading sessions.
- 2 Sellers are showed their presence and continue to put efforts to drag price
Exxon Mobil stock ( XOM ) price is near the critical mark of $100 and shows weakness on the chart. Moreover, the stock is not able to hold a 200 day EMA and is slipping below it, showing that sellers are succeeding in their aim of dragging below the price to retest $100.
The price chart shows a bearish engulfing candle with a gap-down opening in the last sessions which shows signs of bearishness. Furthermore, if the stock is not able to hold the pace of selling near $100, then a fresh downtrend will arise and the stock could slip toward its primary support mark of $98, followed by $92.
The price action shows sellers dominance based on the recent selling in the stock and the stock continued to face distribution over the top rejected from the supply mark of $120, where a double top pattern was formed and sellers started to make short positions resulting in the decline of stock price.
Exxon Mobil Corporation is engaged in the energy business. The Company is engaged in the exploration, production, trade, transportation and sale of crude oil and natural gas, and the manufacture, transportation and sale of crude oil, natural gas, petroleum products, petrochemicals and a range of specialty products.
At press time, XOM stock was traded at $102.73 with an intraday drop of 2.29% showing selling projections. The trading volume in the intraday session was noted at 417.519 Million showed nominal volumes with neutral interest of investors. The buyers are now in a cautious state and sellers showed their giant muscles by throwing the bulls into the backfoot.
Daily Charts In favour of sellers

On the daily charts, XOM stock was in a downtrend and showed a corrective move in the last trading sessions. Furthermore, the stock is slipping below the 200 day EMA showed a hawkish signal that further down move can also be there. If XOM stock is able to sustain above $100, then a rebound can be there to touch the $105 mark again, whereas if follow-on selling arises, then fresh selling pressure can be seen which could lead toward $90.
As per the Fib level, XOM stock is near the 23.6% level and on near the neckline, which if it holds, the buyers would attain strength and accumulation can be there, but if it breaks, then sellers will show their solidity again.
What XOM Indicates on Short Term Charts?
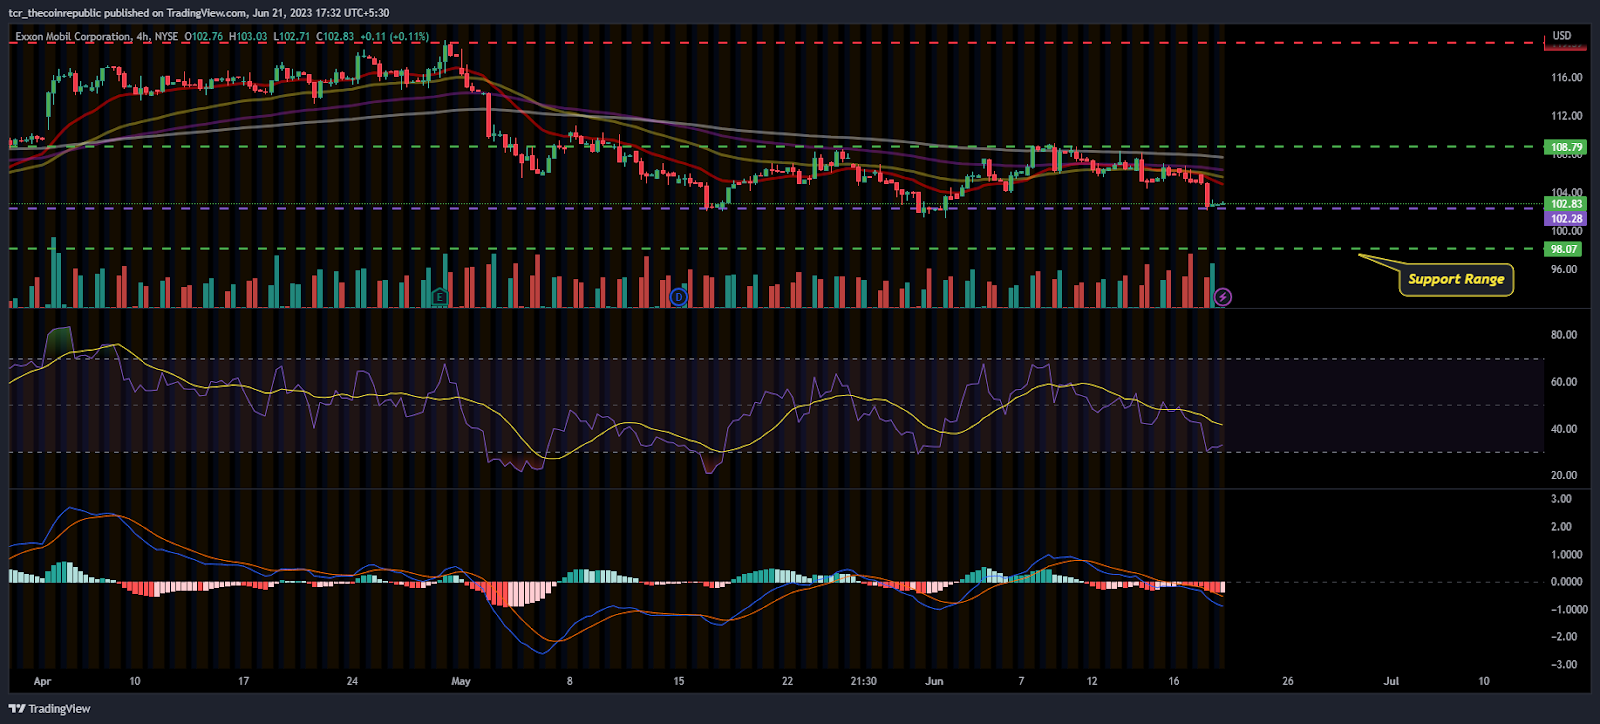
On the 4-hour chart, XOM stock showed bearishness and leading indicators are signalling a negative outlook. Furthermore, a bearish engulfing candle was formed which stretched below the 200-day EMA in the last trading sessions.
The RSI curve is heading toward the oversold region and a negative divergence was noted on the charts. Furthermore, more downtrend can be possible due to the negative crossover.
The MACD indicator also indicates selling pressure with red bars floating on the charts, along with the formation of a bearish crossover.
Conclusion:
XOM Stock is showing a negative outlook and is near the critical level of $100, which could warn investors.
Technical levels:
Major support: $98
Major resistance: $105
Disclaimer:
The views and opinions stated by the author, or any people named in this article, are for informational purposes only and do not establish financial, investment, or other advice. Investing in or trading crypto assets comes with a risk of financial loss.

Andrew is a blockchain developer who developed his interest in cryptocurrencies while pursuing his post-graduation major in blockchain development. He is a keen observer of details and shares his passion for writing, along with coding. His backend knowledge about blockchain helps him give a unique perspective to his writing skills, and a reliable craft at explaining the concepts such as blockchain programming, languages and token minting. He also frequently shares technical details and performance indicators of ICOs and IDOs.


