
 Home
Home News
News

- 1 MANA price is showing a reversal from the bottom.
- 2 Bulls continue to actively accumulate the token.
Decentraland token price is attaining the 20-day EMA mark and returned from the demand zone near $0.3000 in the last trading sessions. The token has been experiencing a downtrend, losing momentum and falling below the key EMA in recent months. However, it is now indicating a desire to regain strength and move towards the 20-day EMA.

The price action shows that the token is in a bearish range and near the selling region where bears could arrive and be dragged towards further lows at any point. Despite buyers’ attempts to exit the range quickly, the token is struggling to gain momentum and surpass the 20-day EMA due to low trading volumes.

At the time of writing, MANA token is trading at $0.3768 with an intraday gain of 1.28%. Moreover, the pair of MANA/BTC is at 0.0000125 satoshis. The intraday trading volume has surged by 7.30% to $55.14 million. The market cap of MANA is at $827.06 million.
Furthermore, the token is displaying a lack of strength and a sequence of lower lows from the past trading sessions during which continued to face selling pressure.
The MANA token is currently showing neutral sentiment with a slight negative bias, primarily attributed to the ongoing downward price movement.
Daily Charts Shows Neutral Moves
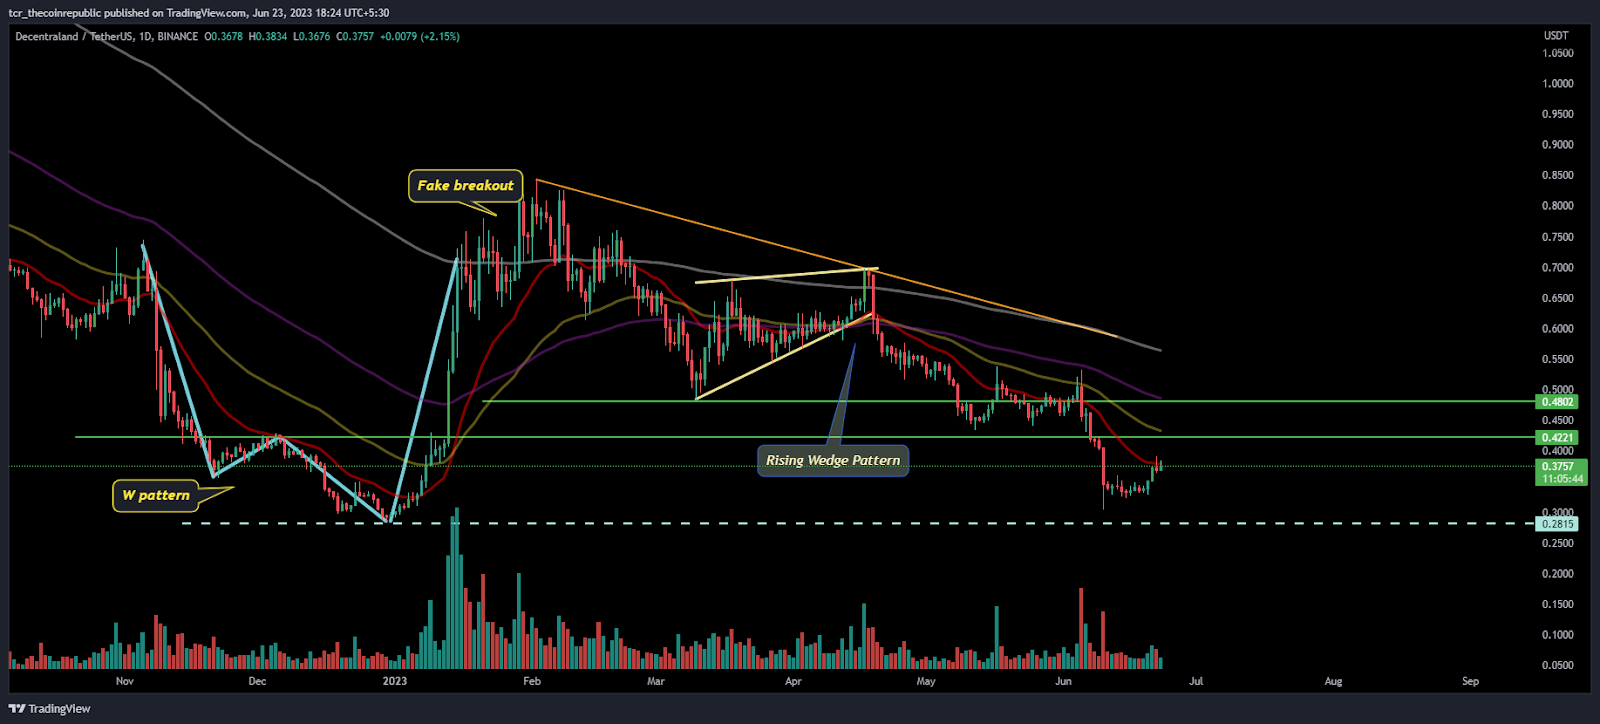
On the daily charts, MANA token is showing a declining trend and displayed a negative outlook in the past trading sessions. Furthermore, buyers are trying to attain strength and are waiting for the right moment to gain traction.
Additionally, MANA token is now reaching the mid bollinger band and is trying to stabilize above it to regain solidity. Moreover, the buyers have started to make long positions based on the bounce from the support level of $0.3000.
Based on the ongoing trend, if the token gathers momentum and maintains its upward movement, it is likely to initially target the immediate resistance level at $0.3900, followed by a retest of $0.4000.
What Do Technical Indicators Say?
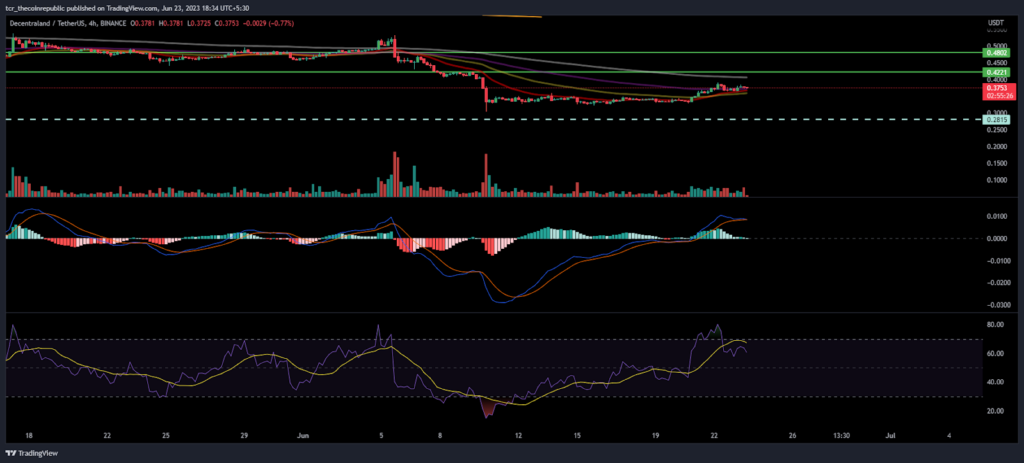
The 4-hour chart of the MANA token reveals a bullish trend that is gaining momentum, signaling a potential reversal in the overall outlook.
The Relative strength index (RSI) curve is starting to escape above the neutral range above 50 and is displaying a positive crossover. Furthermore, the curve is heading towards the upside, indicating that buyers are gaining traction.
The MACD indicator also started to form green bars on the histogram and formed a bullish crossover, indicating bullishness of the token.
Conclusion:
MANA token is looking to go above the 20-day EMA which it attained in the last trading sessions, and is waiting for a follow-up move to extend its rebound.
Technical Levels:
Support Levels: $0.3500
Resistance Levels: $0.4000 and $0.4800
Disclaimer
The views and opinions stated by the author, or any people named in this article, are for informational purposes only and do not establish financial, investment, or other advice. Investing in or trading crypto assets comes with a risk of financial loss.

Andrew is a blockchain developer who developed his interest in cryptocurrencies while pursuing his post-graduation major in blockchain development. He is a keen observer of details and shares his passion for writing, along with coding. His backend knowledge about blockchain helps him give a unique perspective to his writing skills, and a reliable craft at explaining the concepts such as blockchain programming, languages and token minting. He also frequently shares technical details and performance indicators of ICOs and IDOs.


