


VeChain price prediction suggests that the buyers’ optimism in the major cryptocurrencies may get reflected in the price action within the near future. The buyers are making an attempt to propel the VeChain price further according to the candlestick pattern. The buyers presently have a stronghold over the VET token price, which implies that under the bullish charge, the price of VET crypto can see a further increase in its value.
The candlestick patterns are projecting a bullish outlook regarding the VET price in the near future. The VeChain price recently made a Doji and Hammer candlestick pattern which is a positive indicator of a trend reversal. After this, it is developing a three-white soldier pattern which indicates the continuation of a bullish trend.
Increase In Social Engagement Levels Regarding VeChain
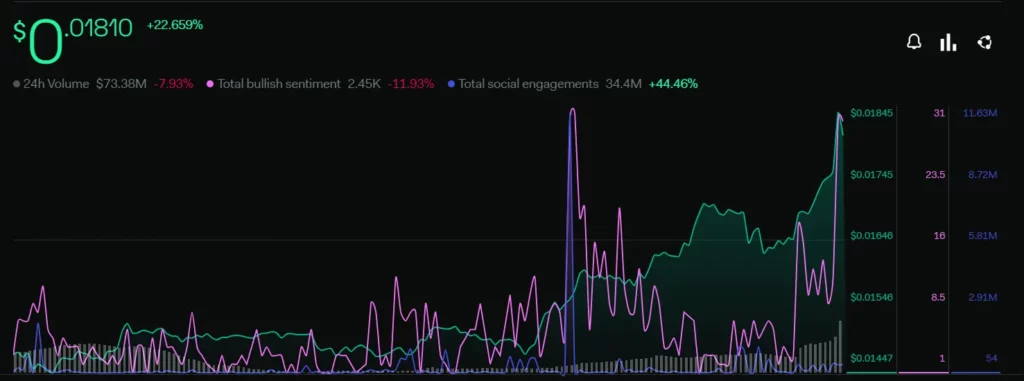
Investor sentiments are taking a negative turn regarding the VET token, according to the LunarCrush platform. Though with the recent developments in the market, investors may change their perspective soon.
The total bullish sentiment metrics of the buyers have declined by 11,99%. There is a 44.46% surge in the total social engagement level which suggests that the buyers for the token are active across various social media platforms.
Major Jump In Greed Sentiment Index
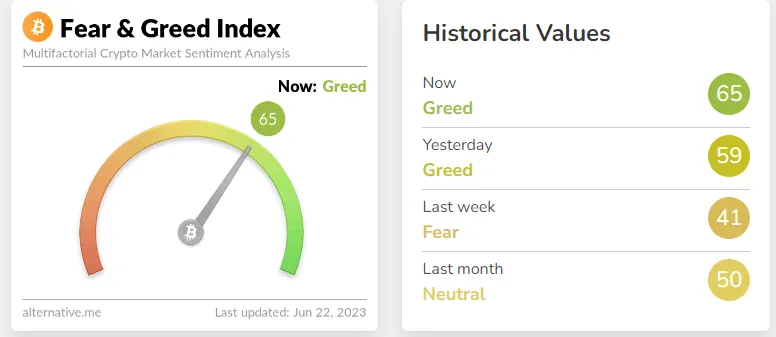
Investor sentiments regarding the overall market are positive. The sentiment metric of the market is seeing an appreciation of 24 points within the last week, where the index was around 41 points. The current value of the greed and fear index is 65 points, according to the Alternative(dot)me platform.
Technical Analysis of VeChain Price
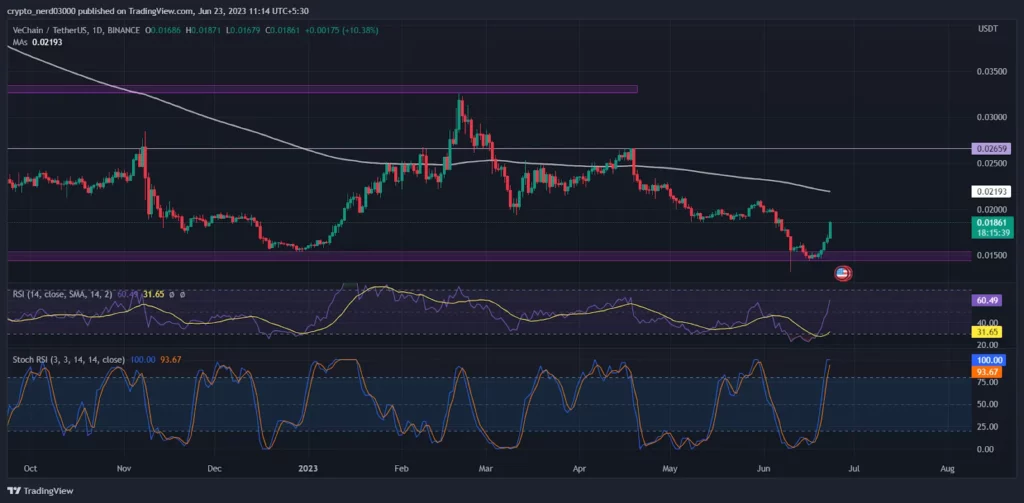
The RSI line is moving above the median line on the daily chart. The current value of the RSI is 60.49. The value of 14 SMA is 31.65 points. As the RSI line indicates that the VET price may make a positive recovery as it is moving toward the oversold zone.
The stochastic RSI has reached the oversold level. At present, the value of the stochastic RSI is 100.0 points which present a contrasting view from the RSI oscillator.
Conclusion
According to the analysis, the buyers are presently dominating the VeChain chart. The RSI and stochastic oscillators present a contrasting view.
Technical Levels:
Support –$0.0100
Resistance – $0.0200


