
 Home
Home News
News
- 1 XMR price is currently (press time) trading at $114.3, with a 10.07% drop in the 24-hour trading volume.
- 2 XMR price is up by 6.50% in the last 7 days.
XMR price recently saw a prominent bearish decline in its value after taking rejection from the 200 EMA, as was estimated in the previous analysis. Currently, the value of XMR is attempting to make a retest through its trendline. If the buyers fail to propel the price above its current resistance levels, it might see a further decline in value, probably with a change in trend.
The Bulls at present are making their best attempt to support the price further though they may find it a challenging task to accomplish as the price has grave resistance levels above it. The price of XMR is seeing a surge of 9.45% within the last 7 days, It is currently making a bullish candlestick pattern which suggests that there is a strong presence of buyers in the market.
The price is trading below its previously established support zone at daily time frames.
Investors Apprehensive on XMR
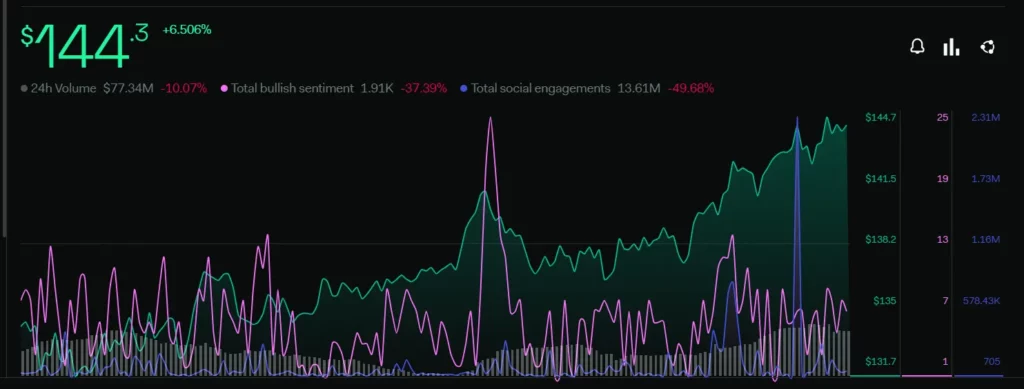
Investors are presently apprehensive regarding the growth of the XMR token in the near future. According to the LunarCrush platform, the bullish sentiments of the buyers are taking a negative turn. The total bullish sentiment metrics have declined by 37.39% within the past few days. The total engagement levels observed a fall of 49.68%.
The 24-hour trading volume indicates that there is a decline in the buying and selling activity. The 24-hour volume fell by 10.07%.
Technical Analysis of XMR Price
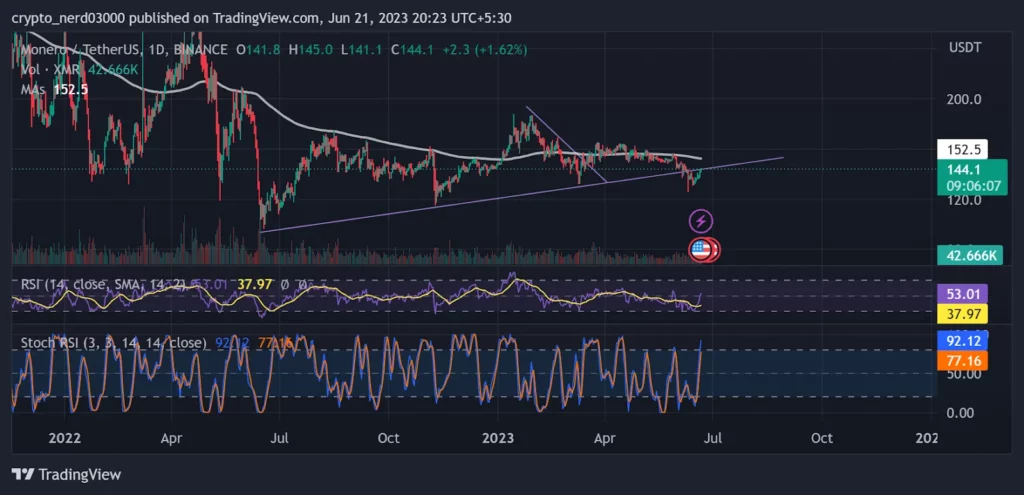
The RSI line is taking a positive reversal from the 30 RSI points. It may soon give a positive interception to the median line indicating that the price of XMR can attempt a positive recovery within the near future. Observing historical data, it can be estimated that the RSI line has been taking constant resistance from the median line. The present value of stochastic RSI is 53.01 points, whereas the 14 SMA is moving around 37,97 points.
The stochastic RSI line has reached the oversold levels after making a double bottom pattern. The current value of stochastic RSI is 92.12 points.
Conclusion
The price of XMR is trading below its previously established support zone. If the buyers fail to propel the price above its current resistance levels, it might see a further decline in value.
Technical levels
Support – $150.0
Resistance – $200.0
Disclaimer
The views and opinions stated by the author, or any people named in this article, are for informational purposes only, and they do not establish financial, investment, or other advice. Investing in or trading crypto assets comes with a risk of financial loss.

Andrew is a blockchain developer who developed his interest in cryptocurrencies while pursuing his post-graduation major in blockchain development. He is a keen observer of details and shares his passion for writing, along with coding. His backend knowledge about blockchain helps him give a unique perspective to his writing skills, and a reliable craft at explaining the concepts such as blockchain programming, languages and token minting. He also frequently shares technical details and performance indicators of ICOs and IDOs.


