
 Home
Home News
News
- 1 1 INCH token price acquired momentum in the last trading sessions.
- 2 Bulls are pulling the reversal showing accumulation.
1 INCH token price is attaining fresh momentum and retrieving strength as it transcends the 20-day EMA barrier. In the previous sessions, the token was coasted into assembling a base building near $0.2300, where buyers started accumulating the token. Afterward, bulls swung into action with sellers on the backfoot, again.
1 INCH is now attempting to escape above its 50-day EMA. The price is near $0.3600 which is acting like a strong resistance.
The ongoing price action shows that the token is acquiring traction and noted a short covering move where the neckline of the ascending triangle pattern was transcended and a bullish candle was closed above the 20-day EMA mark, suggesting buyers sovereignty in the token.
Furthermore, the trend demonstrated a reversal, where an upsurge from buyers and a strong bounce was noted with a volume surge, indicating that investors are keen to raise the token again into the neutrality range near the rounded level of $0.4000, which can be retested in the upcoming sessions.
When writing, 1 INCH trades at $0.3459 with an intraday gain of 7.24%, rebounding from the bottom of $0.2300. The trading volume rose by 8.60 % at $35.07 Million, showing the interest of investors. The market cap of 1 INCH is $323.35 Million.
Daily Charts Show a Reversal
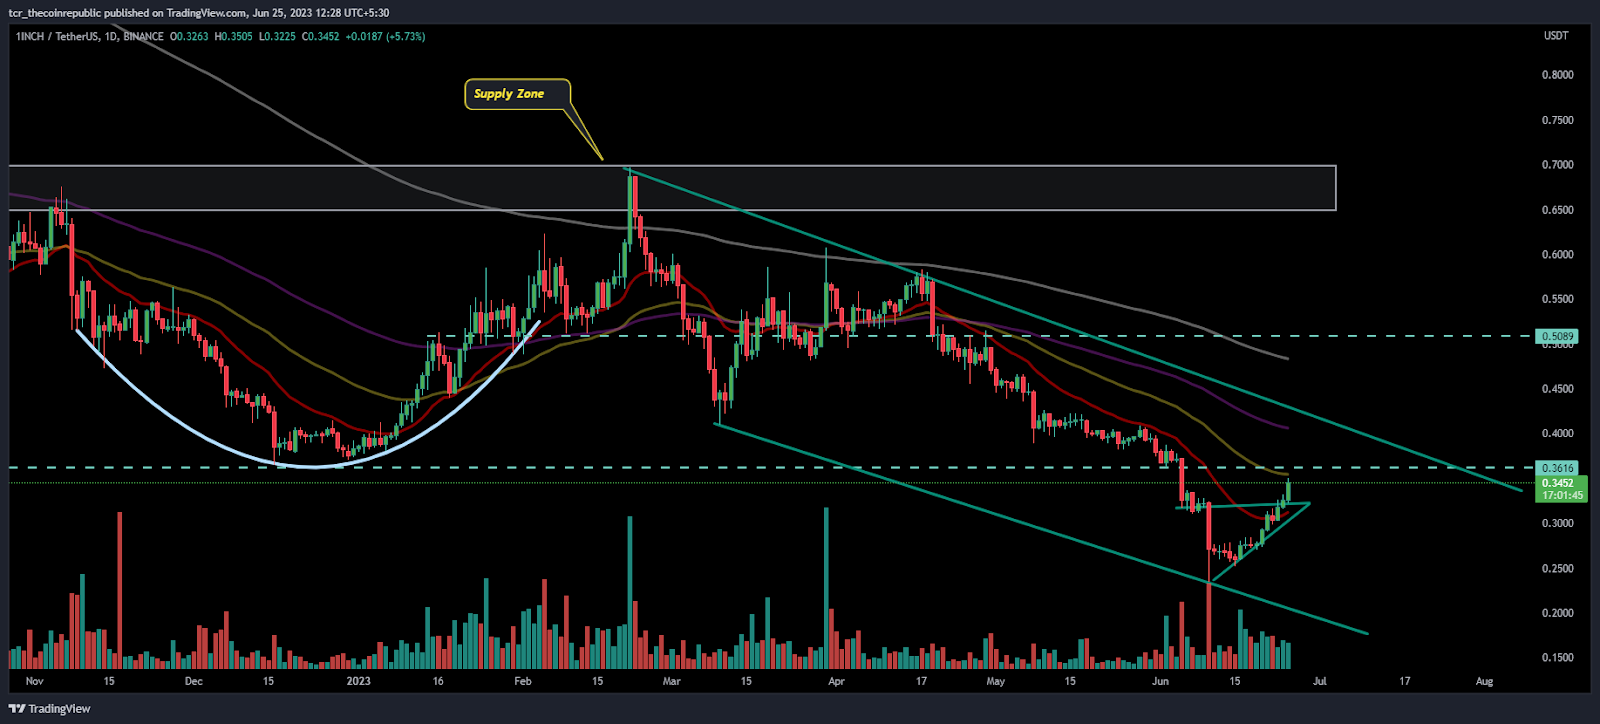
On the daily charts, 1 INCH token exhibits a falling channel, and the price has persisted in forming lower highs and lower lows arrangements in the past trading sessions. Recently, the craze switched, and the token broke its lower high range and sustained above the 20-day EMA near $0.3300, a premature gesture of a new advent of healing and originating signals of an uptrend.
Short Term Chart Shows Range Breakout

On the 4-hour charts, 1 INCH token escaped its neckline resistance mark of $0.3300 and gained strength surpassing the 200-day EMA mark. Furthermore, the consecutive buying in the previous trading sessions shows the pace of momentum of the bulls.
The war between bulls and bears is at an exhilarating stage, where if further follow-on buying emerges and the price flees the $0.3500 mark, hitting $0.4000 eventually, then the rally would demonstrate fresh bullishness.
The RSI curve persists to stay in the overbought zone near 75, showing massive bullishness, forming positive divergence on the charts. The MACD indicator is also signalling the same, showing a bullish crossover, indicating positive outlook.
Conclusion:
1 INCH price is near the 50-day EMA and willing to extend the gains and reach cliffs of bullishness. Indicators are giving bullish signals.
Technical Levels:
Support Levels:$0.3000
Resistance Levels:$0.3600 and $0.4000
Disclaimer
The views and opinions stated by the author, or any people named in this article, are for informational purposes only and do not establish financial, investment, or other advice. Investing in or trading crypto assets comes with a risk of financial loss.

Andrew is a blockchain developer who developed his interest in cryptocurrencies while pursuing his post-graduation major in blockchain development. He is a keen observer of details and shares his passion for writing, along with coding. His backend knowledge about blockchain helps him give a unique perspective to his writing skills, and a reliable craft at explaining the concepts such as blockchain programming, languages and token minting. He also frequently shares technical details and performance indicators of ICOs and IDOs.


