
 Home
Home News
News
- 1 XMR price is regaining strength and attaining momentum.
- 2 Bulls are showing their aggressiveness with a massive spike.
Monero (XMR) price chart shows a massive spike and a short covering move attaining strength. Moreover, this bounce led sellers to get trapped, back footed and cautious. The consecutive buying led by buyers showed that the mature investors initiated long buildup activity, and the price is near the immediate hurdle of $168, which, if surpassed, will head toward the next hurdle of $175 followed by $188, as shown on the charts.
The ongoing price action shows that XMR is regaining shape and attaining fresh buying momentum, which showed the aggressiveness of bulls that led to the defeat of bears.

Furthermore, XMR is sustaining above the 200-day EMA with substantial volume showing that buyers have attained a perfect pace and are holding their grip. Also, multiple resistance levels were broken and a golden crossover formed, favouring the bulls and indicating a further rally expansion.
At the time of writing, XMR price is trading at $167.26 with an intraday gain of 1.92%. Moreover, the intraday trading volume noted an increase of 3.05% at $138.47 Million. Furthermore, the pair of XMR/BTC is at 0.00544 BTC, and the market cap is $3.04 Billion.
Daily Charts Shows Sellers Trapped
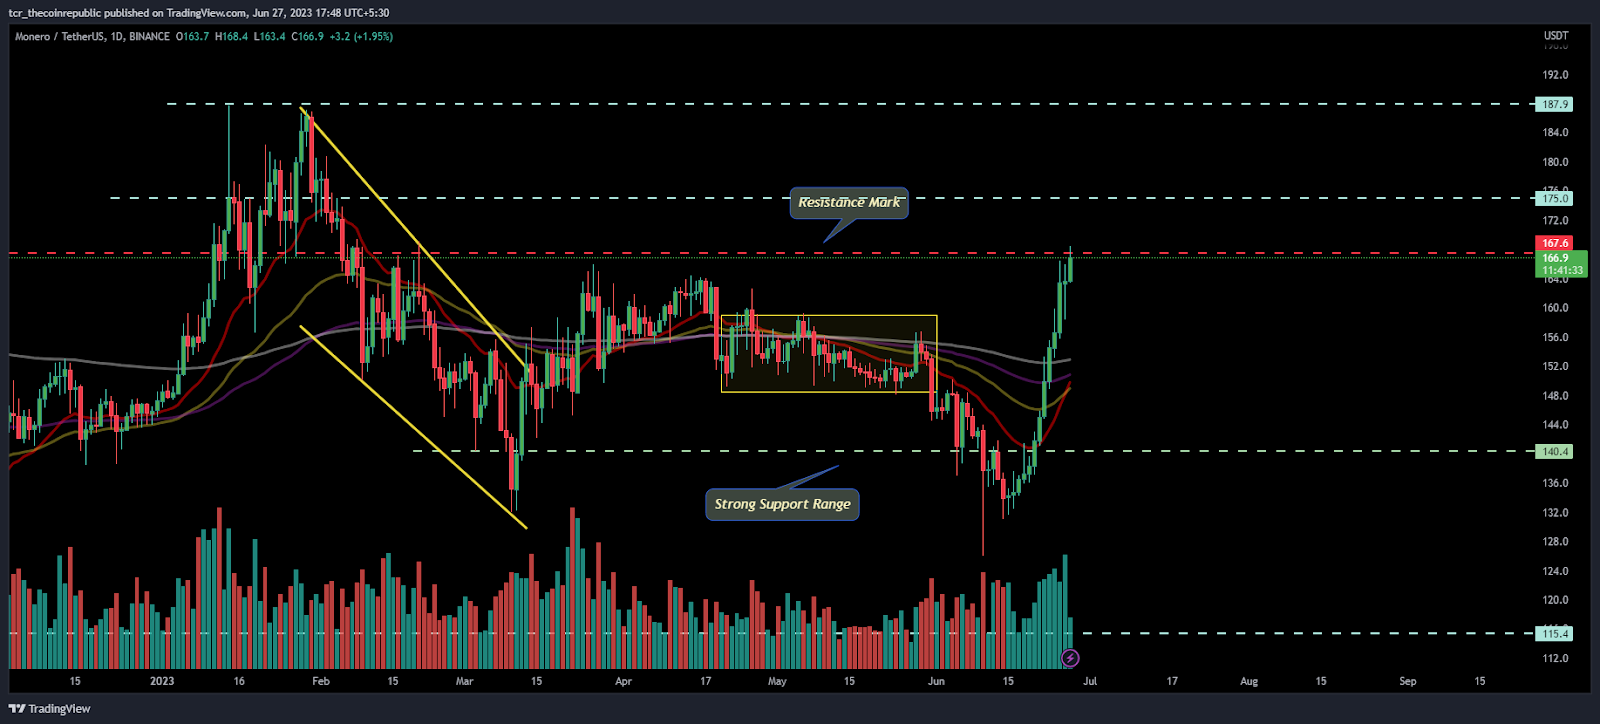
On the daily charts, the XMR token price shows a massive rally, rebounding from the demand zone of $130. On that mark, a rejection candle was noted with a long wick revealing the buyers’ intent to defend that range. The buyers led a follow-on buying, crossing the ongoing hurdle decisively with substantial volumes.
As per the Fib levels, the XMR token price is approaching the 61.8% level and formed a bullish marubozu candle, showing that it is fully prepared to cross that mark too and heading towards the next target of 78.6% level, which is near $175.
What the Technical Indicators Show?

On the 4-hour charts, the XMR token shows a one-way bullish move and rides the rally, forming higher highs. At the same time, a profit booking move was noted in the previous sessions, which needs a further retracement for an upcoming breakout above the hurdle of $170.
The RSI curve is flying above the bars near 65, showing a positive divergence but slipped in the last session showing a little profit booking on the top, indicating rejection at the resistance mark.
The MACD indicator shows a bearish crossover, but due to the low volumes, it doesn’t inspire seller confidence. The buyers are also attempting a further pullback.
Conclusion:
XMR token chart structure shows sellers are trapped, and the buyers have attained strong momentum leading to an enormous move.
Technical Levels:
Support Levels:$160 and $150
Resistance Levels:$175 and $188
Disclaimer
The views and opinions stated by the author, or any people named in this article, are for informational purposes only and do not establish financial, investment, or other advice. Investing in or trading crypto assets comes with a risk of financial loss.

Andrew is a blockchain developer who developed his interest in cryptocurrencies while pursuing his post-graduation major in blockchain development. He is a keen observer of details and shares his passion for writing, along with coding. His backend knowledge about blockchain helps him give a unique perspective to his writing skills, and a reliable craft at explaining the concepts such as blockchain programming, languages and token minting. He also frequently shares technical details and performance indicators of ICOs and IDOs.


