
 Home
Home News
News

- 1 Frax Share price is currently trading at $6.49 while witnessing a gain of 0.14% during the intraday session.
- 2 FXS price has crossed above the 20 and 50-day EMAs.
- 3 The year-to-date return of Frax Share is 57.31% while the three-month return is -33.08%.
FXS price has been in a downtrend, forming lower lows and lower highs after it faced strong resistance from $12 in the beginning of March. The price attempted to retest $12 after forming support at $7.41 in the same month, but the move was halted at $10.40.

The cryptocurrency’s price has recently formed support at $4.70 after starting the month of June with a drastic downfall. The support aided the price in gaining bullish momentum but the price got stuck again in a narrow consolidation zone ranging between $5.38 and $6.08.

On July 3, FXS price finally gained enough bullish momentum to break the resistance level of $6.08. The recent candle seems to be losing bullish momentum as the bodies of the candles are small. The price has crossed the $6.50 psychological level and is headed toward the next major resistance level of $7.41.
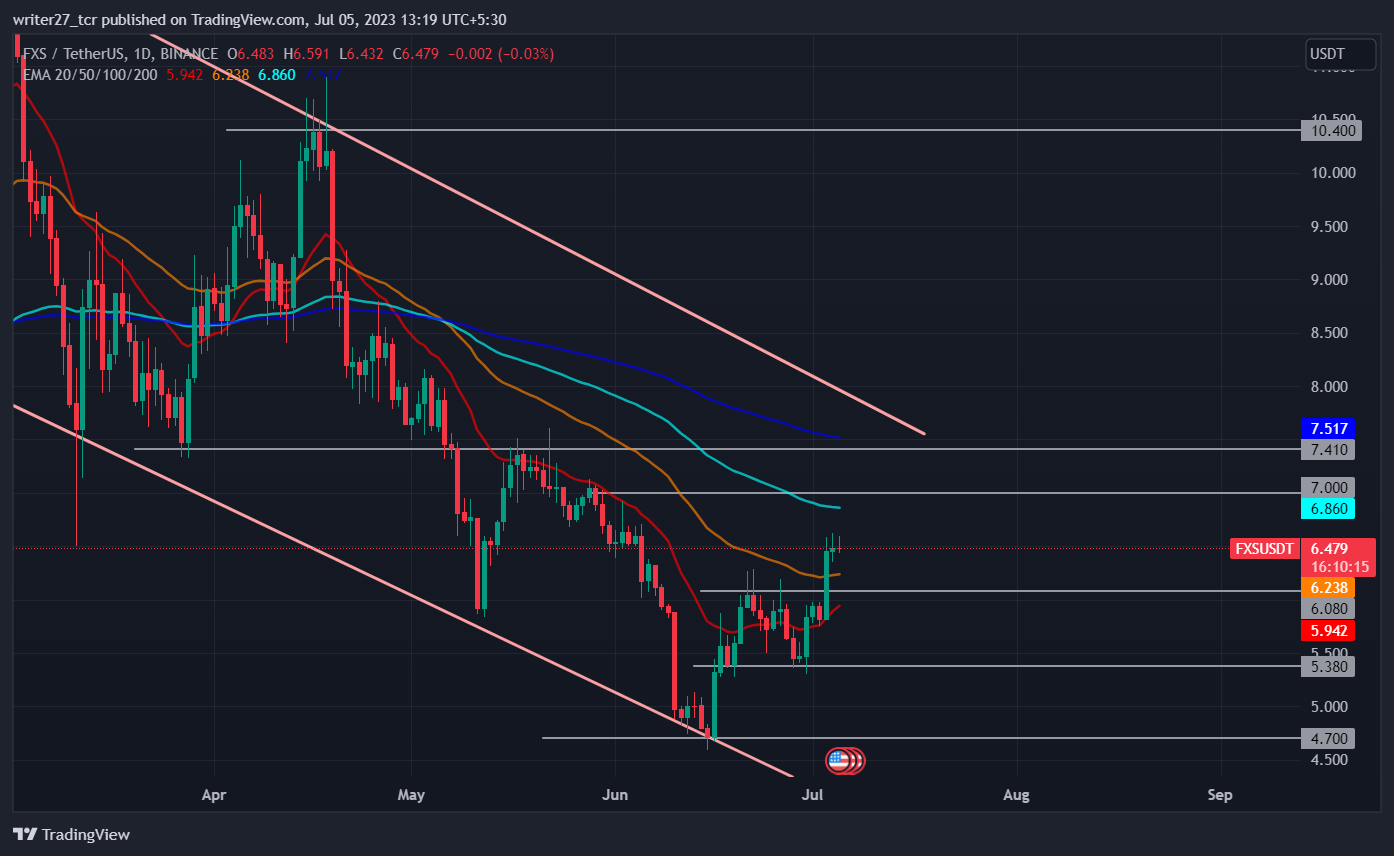
The previous candle and current candle are facing rejection from the $6.60 level and if a break of this level happens, the price might rise toward $7, thereby causing an increase of roughly 7%. If the rejection continues and bears enter the market, there is a possibility that price might head back into the zone and target the support level of $5.38.
If the price can break the trendline and rise above $8, then there is a chance that the price might retest the $10.40 resistance level. The market capitalization of Frax share is down by 0.01% to $473 million and the 24-hour trading volume has decreased by 39.96%.
Will FXS Price Rise Above $7?
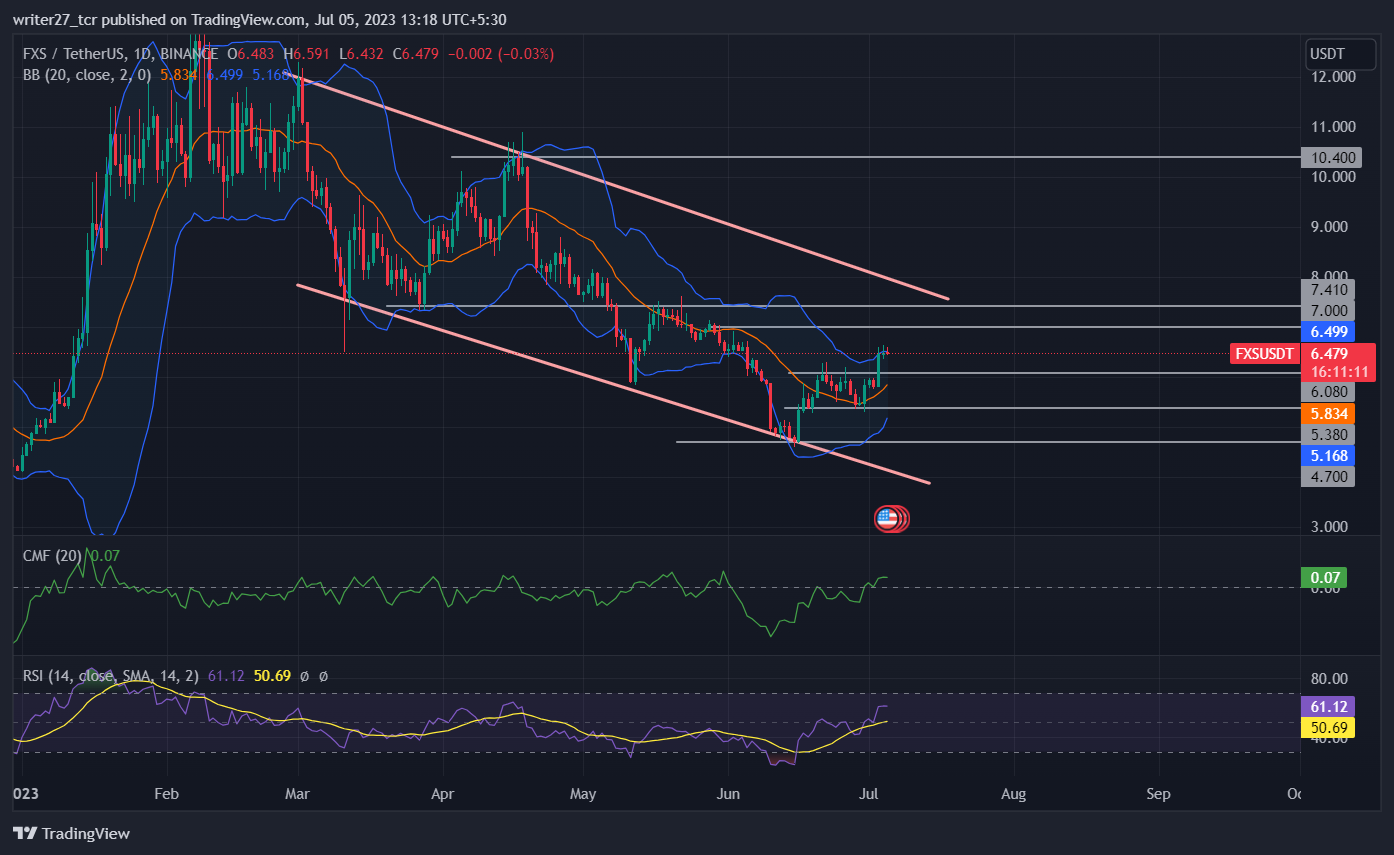
FXS price has crossed above the 20 and 50-day EMAs, positively indicating that the price is gaining bullish momentum. However, there is a concern over the resistance that price is facing from the $6.60 level. Chaikin money flow score is 0.07, suggesting that there is strength in the market.
The relative strength index (RSI) has crossed the 60 mark and is currently trading at 61.42, implying that price possesses bullish momentum. The cryptocurrency price has reached the upper band of bollinger, which indicates a possibility for short-term pullback and also points to a possible reason behind rejection.
The price might head toward the 20-day SMA to form support if bullish momentum prevails. The long/short ratio of Frax share is 0.964 with 49.09% longs and 50.91% shorts, indicating slightly higher pressure from bears in the last 24 hours.
Conclusion
The market structure and price action of Frax share has turned bullish as the crypto market gained bullish momentum due to the rally by Bitcoin and Ethereum since June 15. The technical parameters suggest increased participation of buyers, but the recent candle shows that there is a decrease in the bullish momentum.
Technical Levels
Major support: $4.70 and $5.38
Major resistance: $7 and $7.41
Disclaimer
The views and opinions stated by the author, or any people named in this article, are for informational purposes only. They do not establish financial, investment, or other advice. Investing in or trading crypto assets comes with a risk of financial loss.
Mr. Pratik chadhokar is an Indian Forex, Cryptocurrencies and Financial Market Advisor and analyst with a background in IT and Financial market Strategist. He specialises in market strategies and technical analysis and has spent over a year as a financial markets contributor and observer. He possesses strong technical analytical skills and is well known for his entertaining and informative analysis of the Financial markets.


