
 Home
Home News
News
- 1 Polkadot price prediction forecasts a bearish outlook.
- 2 Polkadot recorded a 15.22% increase in 24-hour trading volume.
- 3 The DOT price can see a decline in its value within a week.
Polkadot price prediction indicates that the bears are starting to step into the price action on the daily timeframe. The Polkadot price is taking severe resistance from the previous support level whereas the 200 EMA is trading just above it. After making a spinning top candle in the supply zone it is seeing a slight decline in value. DOT could attempt to find support near the 50 EMA though the probability of being able to sustain above it, is minuscule.
The majority of technical indicators project an outlook in the bears’ favor. The RSI and stochastic RSI are indicating that Polkadot crypto is overvalued at present. The oscillators have reached the supply zone indicating a bearish reversal in the near future. The 100 and 200 EMAs are providing grave resistance to the token.

At publication time, Polkadot was valued at $5.302. It has a market capitalization of around $6.29 Billion which has been rising through the week.
The Increase in Overall Parameters
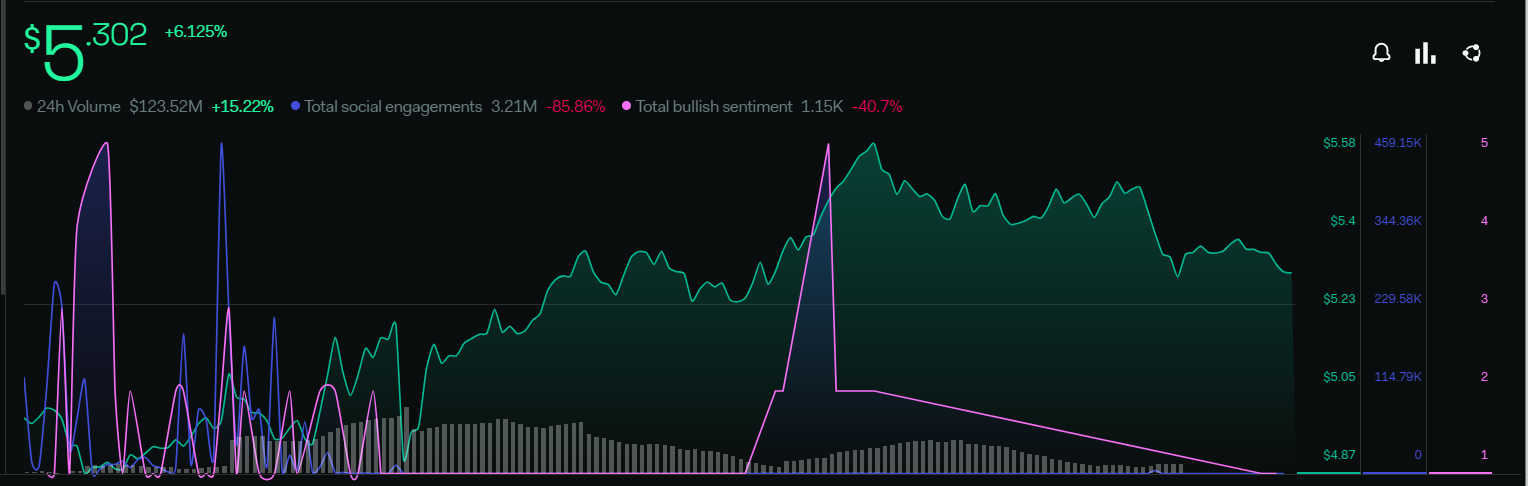
The overall parameters on LunarCrush indicate that there is a fall in multiple social media metrics. Total bullish sentiment metrics fell by 40.7%. Whereas, there is an 86.86% fall in Total Social Engagement volume over the past week.
Despite the fall in most of the parameters, the 24-hour trading volume is up by 15.22%, indicating that there is more trading activity between the buyers and sellers regarding Ripple within the last few weeks.
Polkadot Price Prediction: Technical Analysis On 1 Day Timeframe
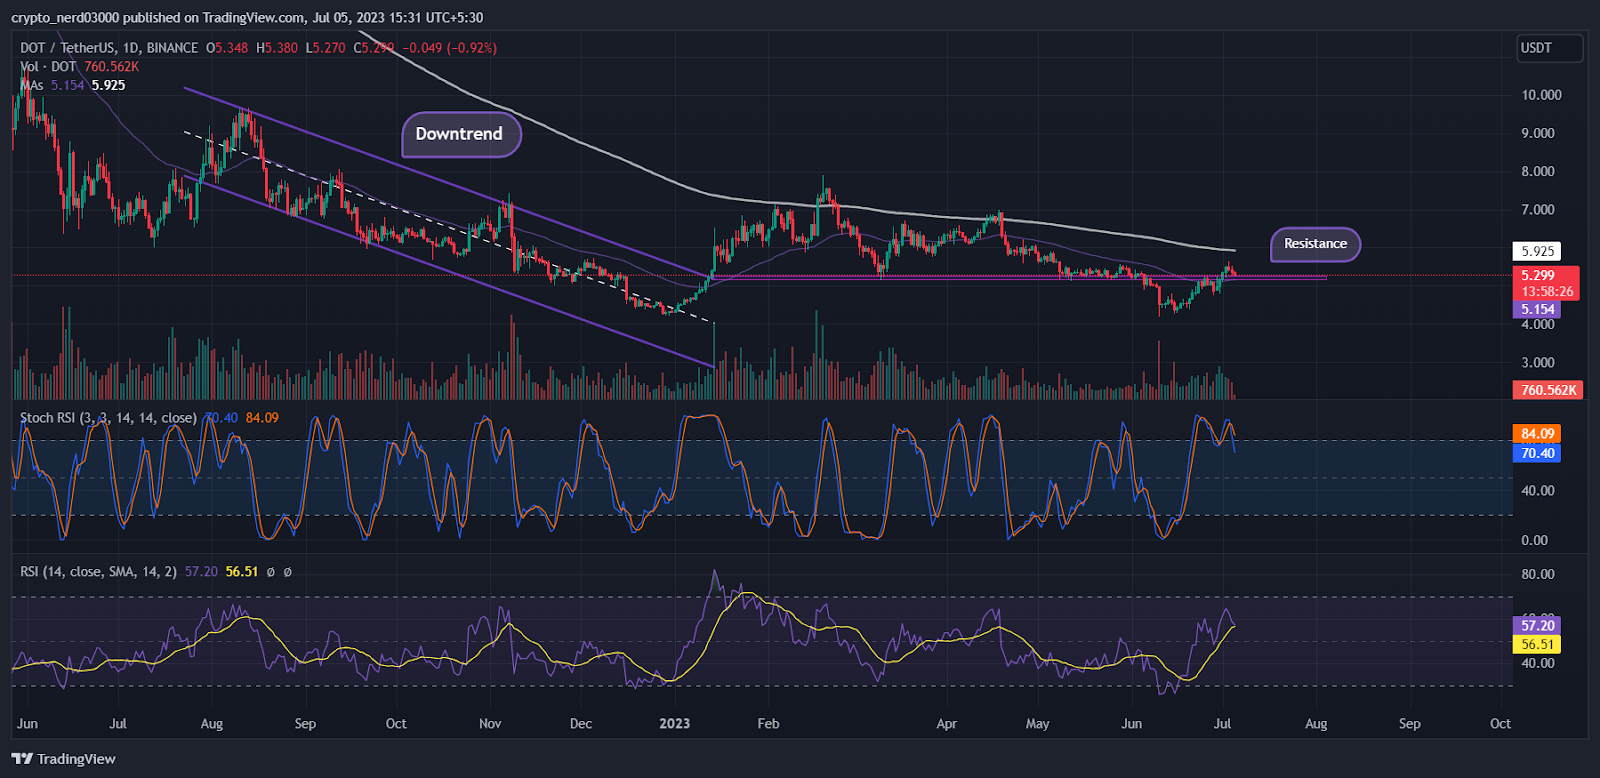
The RSI oscillator is moving near the overbought level. The current value of RSI is 57.20 points, whereas the 14 SMA is providing support to it at 56.51 points.
The stochastic RSI is making a double-top pattern. The value of the stochastic RSI is 70.40 points. The %K and %D lines may soon give a bearish interception to the median line.
Conclusion
The analysis of the price action of Polkadot suggests that investors’ views regarding DOT token is taking a negative turn. The oscillators are moving near the supply zone.
Investors are presently observing a surge in the selling pressure within the Polkadot price. If the price fails to gain support from the 50 EMA near its immediate support zone, it could decline by 18.92% soon after. Multiple resistance levels may prove to be challenging for the bulls that are aiming for a breakout.
Technical levels –
Support – $150.0
Resistance – $400
Disclaimer
The views and opinions stated by the author, or any people named in this article, are for informational purposes only, and they do not establish financial, investment, or other advice. Investing in or trading crypto assets comes with a risk of financial loss.

Andrew is a blockchain developer who developed his interest in cryptocurrencies while pursuing his post-graduation major in blockchain development. He is a keen observer of details and shares his passion for writing, along with coding. His backend knowledge about blockchain helps him give a unique perspective to his writing skills, and a reliable craft at explaining the concepts such as blockchain programming, languages and token minting. He also frequently shares technical details and performance indicators of ICOs and IDOs.


