
 Home
Home News
News
- 1 Dow Inc. (DOW) is trading at $52 with a minor dip of 0.11% in the previous trading session.
- 2 Dow Inc.’s 52-week price range is $42.91-$53.44 and its market capitalization is $37.375 Billion at press time.
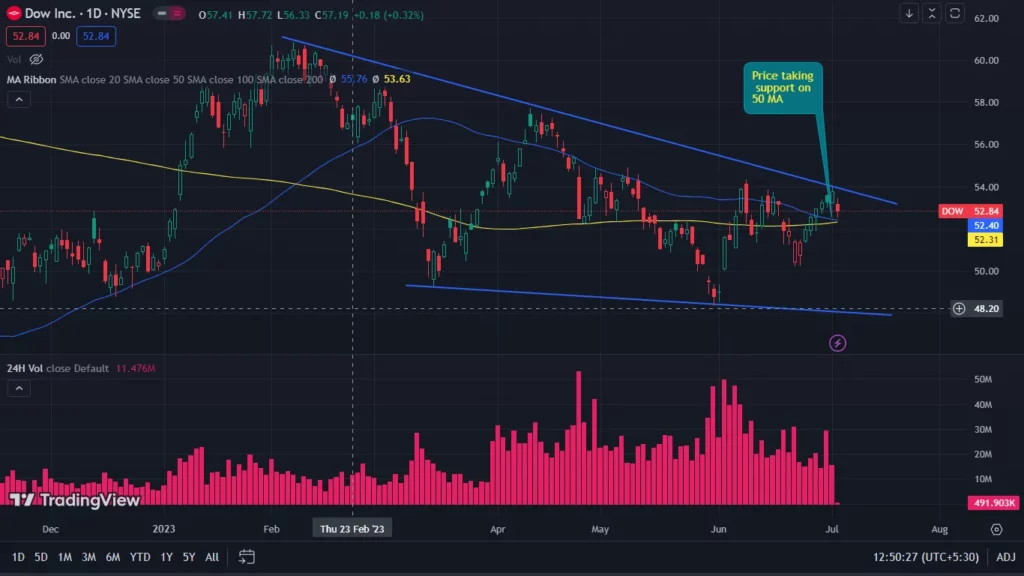
Dow Inc. stock is trading within a falling wedge pattern. However, the price is currently taking support on the 50-moving average with a red candle. Meanwhile, the current situation is suggesting that traders should wait until any breakout or breakdown of the price. The current situation is looking indecisive.
DOW Inc. is a diversified chemical manufacturing company integrating technology to produce innovative solutions. However, the company’s works contain Packaging & Specialty Plastics, Industrial Intermediates & Infrastructure, and Performance Materials & Coatings. DOW has a PE of 6.6 and a + 5% dividend yield which is seen in a good quality stock
A cursory analysis of historical price data shows that DOW Stock is in an uptrend. The profit margin of the stock is 32.54%. DOW is performing well right now. From its 52-week bottom price of $42.91, it increased to a $60.8 peak price. The present market sentiments are very optimistic about the stock. The average 3 months volume in DOW is $4.47 Million.
Dow Inc. Stock Technical Analysis
The price of DOW has slipped above 50 and 200 MAs, suggesting that the price is bullish. However, presently, it is resting at 50 MA. DOW price could increase over the week depending on the buying pressure.
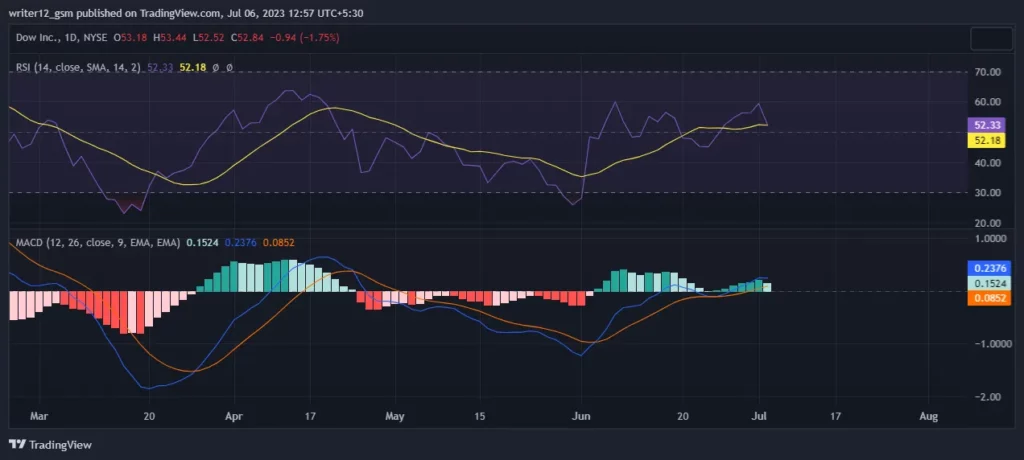
The MACD is also in the positive area. The MACD line is at 0.2376, and the signal line at 0.0852 is above the zero line, suggesting the MACD is in bullish territory and giving bullish signals.
The current value of RSI is 52.33 points, and the 14 SMA line is above the median line, around 52.18 points which shows neutral sentiment in the market. The 14 Day SMA line beyond the median line reveals a possible bullish trend. The bullish sentiment spreads around the market. Meanwhile, the price is currently in an overbought area.
Summary
DOW’s Price Prediction is indecisive right now. However, the price is near the crucial support, and the buyers are trying their best to make the most of it. The price action indicates that it may advance in the upcoming days if the bulls support it and the stock breaks the wedge. The EMA, RSI, and MACD give positive signals about DOW stock. Meanwhile, the current situation suggests that traders should wait until any breakout or breakdown of the price.
Technical Levels:
Support – The current support level is $52.04.
Resistance –The current resistance levels are $55.56 and 57.25.
Disclaimer
The analysis given in this article is for informational and educational use only. Do not take this information as financial or trading advice. Trading and investing contain financial risk. Before making any investment or trading decision, please consider your risk profile and circumstances.

Andrew is a blockchain developer who developed his interest in cryptocurrencies while pursuing his post-graduation major in blockchain development. He is a keen observer of details and shares his passion for writing, along with coding. His backend knowledge about blockchain helps him give a unique perspective to his writing skills, and a reliable craft at explaining the concepts such as blockchain programming, languages and token minting. He also frequently shares technical details and performance indicators of ICOs and IDOs.


