
 Home
Home News
News
- 1 As per Uniswap Price Prediction, the coin price increased by 1.19% over the last 24 hours.
- 2 The price of the UNI coin is trading at $5.388 and the 52-week price bound range is $3.76 – $9.74.
Uniswap has recently shown a decline of -7.92% in Open Interest in the last 24 hours. The 24-hour long versus short ratio is 0.952. The total number of short positions added in the last 24 hours is $7.88K against longs of $123.31K.
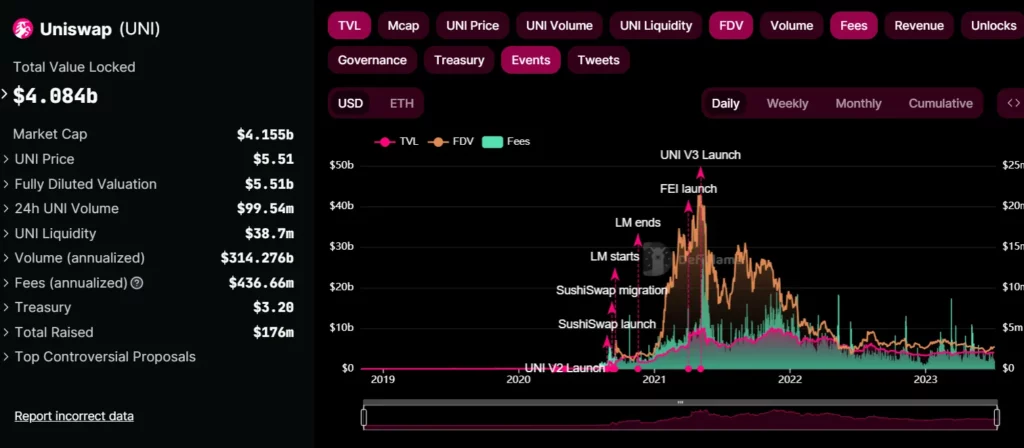
However, the 24-hour UNI coin volume is $99.54 million, and UNI coin liquidity is $38.7 million. Moreover, the market cap of the Uniswap coin is $4.155 Billion, and the UniSwap Platform’s fees parameter is also bouncing back after a drop in early January. The current value of yearly fees produced by UniSwap is $436.66 Million.
Uniswap’s TVL has been almost flat for the last few months. It reached its peak on 10 May 2021, at about $9.892 Billion, while fees were $12.34 million and FDV was $39.475 Billion. After a sharp drop where the TVL halved, it is now trying to recover buyer interest. Uniswap’s TVL by July 6th,2023 is 4.05 Billion, while FDV and fees fell significantly by $5.42 billion and $1.3 million respectively.
Uniswap price prediction highlights that the coin performed well this month as it was up by 13.99%. However, UNI price was slightly down by 2.99% in the last six months which gave a slight underperformance over six months. Moreover, the Uniswap coin price year-to-date return is positive, increasing by 5.16%.

Uniswap Price Technical Analysis in 1-D Timeframe
As per the price action in the long term, it seems the price is following the trendline and taking support and resistance over the trendline. As observed from the UNI coin chart, the price was in a correction phase it fell nearly 48% from February to June, while forming a falling wedge pattern. However, the price got major support on June 12th from the demand zone. Where bulls came in and displayed roughly 40% up move momentum to the price within a month and spiked upwards swiftly by making higher highs and higher lows.
Moreover, at the time of publishing the price also gave a breakout of the falling wedge pattern but seems exhausted as the coin price lacks volume which is not producing enough momentum in the price as of now. Hence, if bears appear in the near time there are slim chances that the price might break the nearest support which is at $4.90, or if volume shows up we may see an upward rally to the next resistance level which is at $6.20. Therefore, we can anticipate more upward move only if more volume accumulates.
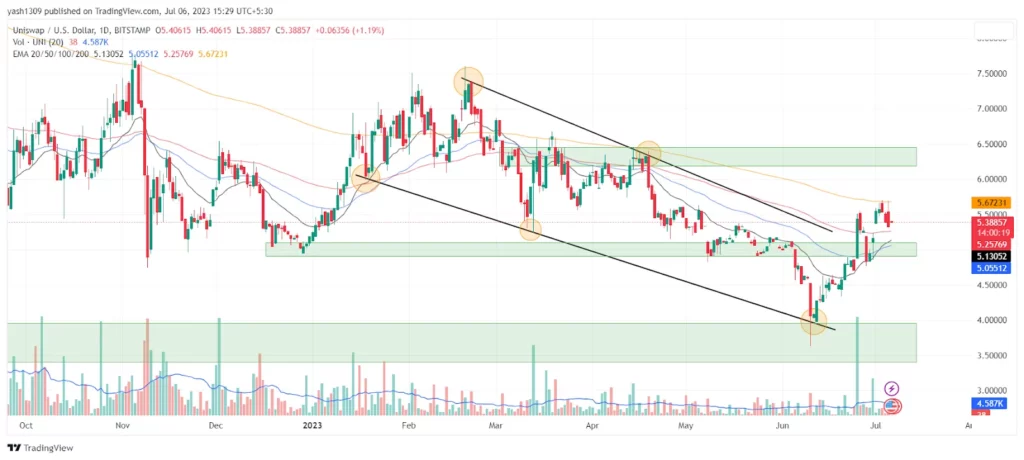
At the time of publishing, the Uniswap coin price is trading above the 20, 50, and 100 EMA (exponential moving average), which is supporting the price trend. More upward movement is expected in the short term for the stock.
However, the stock price remains below the 200-day EMA. To jump over the 200 EMA, the UNI coin must accumulate more buyers and sustain a price above 200 EMA in the longer trend to surpass the hurdles. There is a possibility that the UNI price will increase even further and More upward movement is expected for the coin in the upcoming days
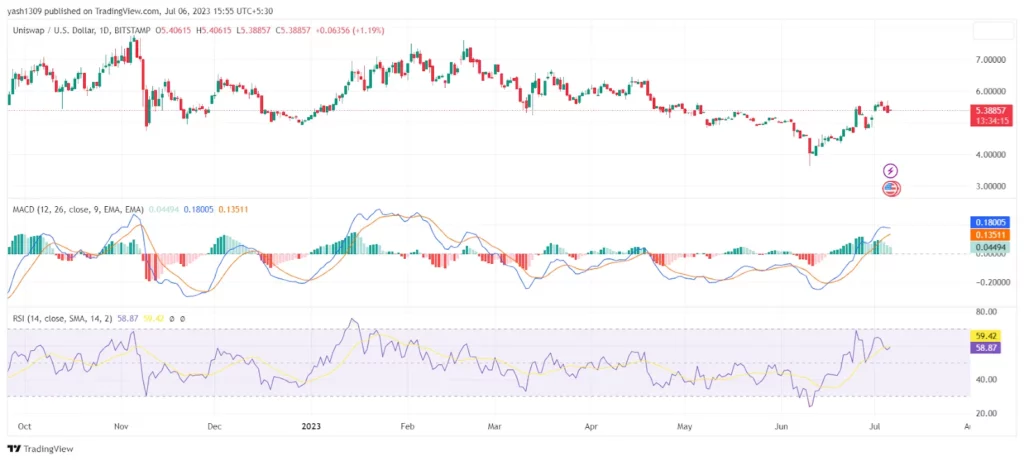
The MACD line at 0.18005 and the signal line at 0.13511 is above the zero line and gave a bullish crossover, suggesting bullish signals. The current value of RSI is 58.87 points and the 14 SMA is above the median line at 59.42 points, indicating an upward direction and bullish sentiment in the market.
Summary
Uniswap price prediction highlights the sentiments and perspectives of investors and traders regarding the UNI coin price being bullish in the 1-D time frame. The UNI price action reflects an optimistic view at the time of publishing. The UNI price’s technical parameters suggest the uptrend’s continuation over the daily time frame chart. The UNI coin price reflects an optimistic view at the moment.
Major legitimate indicators MACD, RSI, and EMA, flaunt positive signals about the UNI coin price.
Technical Levels:
- The nearest support: $4.90 and $3.91.
- The nearest resistance: $6.20 and $7.36.
Disclaimer
In this article, the views and opinions stated by the author or any people named are for informational purposes only, and they don’t establish the investment, financial, or any other advice. Trading or investing in cryptocurrency assets comes with a risk of financial loss.

With a background in journalism, Ritika Sharma has worked with many reputed media firms focusing on general news such as politics and crime. She joined The Coin Republic as a reporter for crypto, and found a great passion for cryptocurrency, Web3, NFTs and other digital assets. She spends a lot of time researching and delving deeper into these concepts around the clock, and is a strong advocate for women in STEM.


