
 Home
Home News
News
- 1 Bitcoin Gold is trading at $14.31 while seeing a rise of 123% in the 24-hour trading volume (press time).
- 2 The Bitcoin Gold price recorded a surge of 0.62% in the last 7 days.
Bitcoin Gold price prediction suggests that the BTG token is taking a retest from the 200-day EMA. The price has been moving within a sideways range in the supply zone after the downtrend. The price action indicates that buyers are interested in the token. It is facing resistance from the 200 EMA as it attempts to rally. Bitcoin Gold price has been acquiring consistent backing from buyers near $0.01800 for the past few weeks.
Bitcoin Gold is a hard fork of Bitcoin which is an open source cryptocurrency. Bitcoin Gold is an open-source decentralized cryptocurrency that can be exchanged between users on the Bitcoin Gold network. It operates without a central bank or intermediary.
Decrease In LunarCrush Levels: Bitcoin Gold

Despite the drop in the majority of parameters shown on the LunarCrush platform, the 24-hour volume of BTG token observed a significant spike. It recorded a surge of 123%.
The total bullish sentiment metric receded by 98.01%. A sharp fall of 100% was also observed in the total social engagement level which suggests that the potential buyers in the community are showing apprehension regarding BTG crypto.
Significant Hike In Greed Sentiment Of Investors
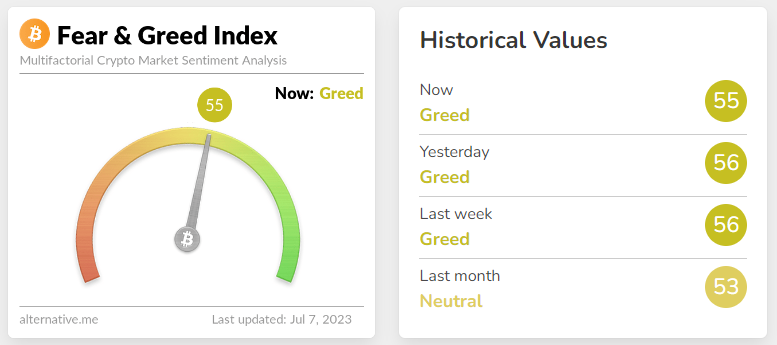
Investor sentiments concerning the overall cryptocurrency market are reaching the neutral zone. The sentiment index metric declined slightly within a brief period of time. The current value of the sentiment index is 55 points above the neutral zone as per the Alternative(dot)me platform.
Bitcoin Gold Price Prediction: Technical Analysis On Daily Timeframe
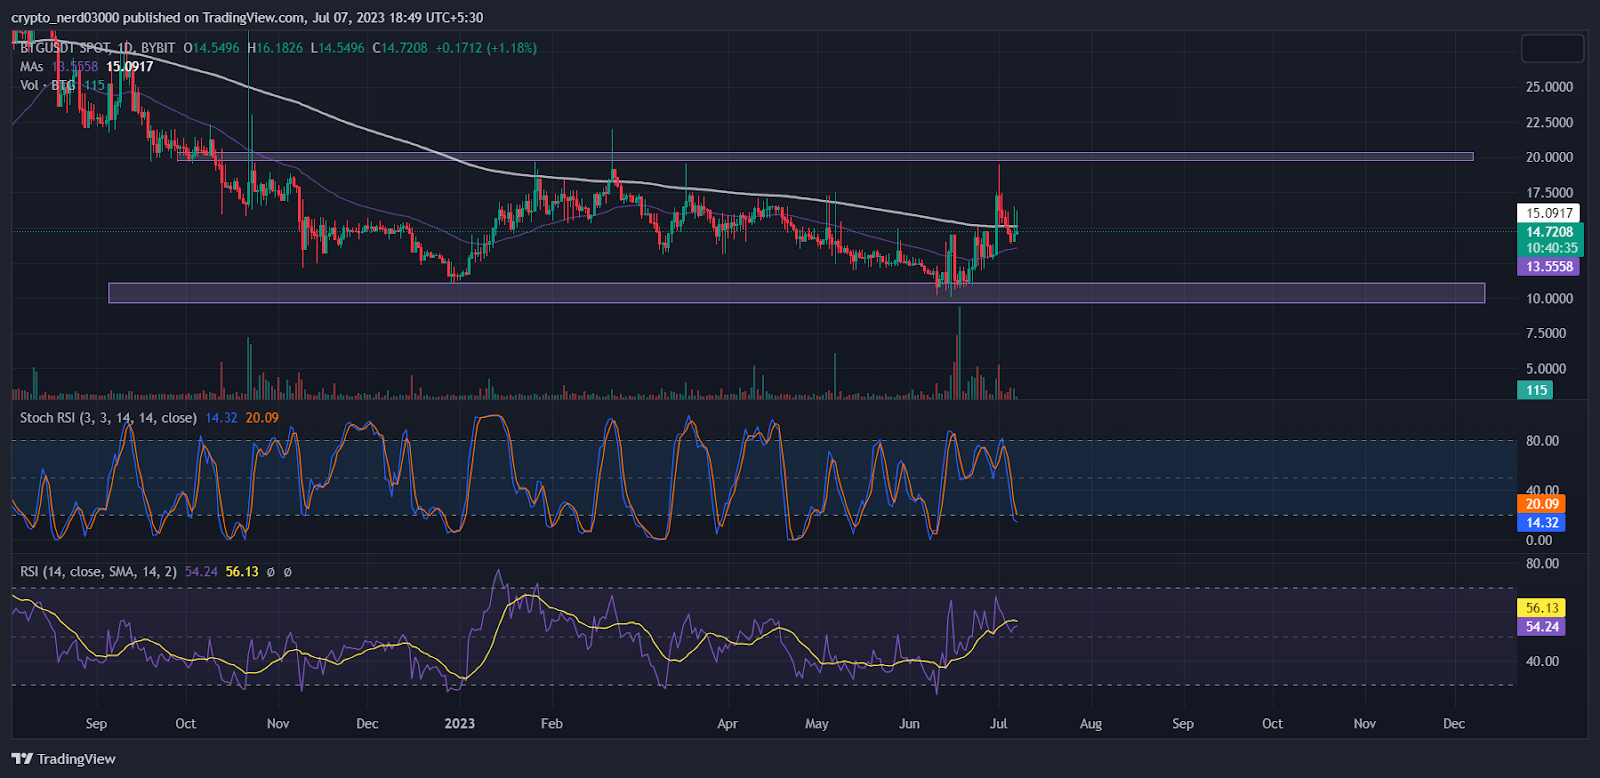
The relative strength index (RSI) line has recently given a negative crossover to the 14-day SMA. The present value of the RSI is 54.24 points and the value of the 14-day SMA is 56.13 points. The RSI line is making a higher high and low pattern.
At present, the stochastic RSI is advancing towards the demand zone and the value of the stochastic RSI is 14.32 points. The %K and %D may soon give a positive cross near the demand zone.
Conclusion
As per the analysis, technical indicators, and price action, the bulls are doing their best to make a breakout above the 200 EMA resistance level. The oscillators are giving bullish indications. The 24 hour trading volume saw an abrupt spike in value which suggests that BTG token is being actively exchanged between buyers and sellers.
Technical Levels:
Support –$10.000
Resistance – $20.000
Disclaimer:
The views and opinions stated by the author, or any people named in this article, are for informational purposes only, and they do not establish financial, investment, or other advice. Investing in or trading crypto assets comes with a risk of financial loss.

Andrew is a blockchain developer who developed his interest in cryptocurrencies while pursuing his post-graduation major in blockchain development. He is a keen observer of details and shares his passion for writing, along with coding. His backend knowledge about blockchain helps him give a unique perspective to his writing skills, and a reliable craft at explaining the concepts such as blockchain programming, languages and token minting. He also frequently shares technical details and performance indicators of ICOs and IDOs.


