
 Home
Home News
News
- 1 Micron Technology Inc. price fell by 1.34% over the last 24 hours.
- 2 The Micron Technology Inc. ( NASDAQ: MU) stock traded between $48.43 – $74.77 in the 52-week period.
The Micron Technology Inc. price chart shows that the average volume is 18.44 Million and the current volume is 15.62 Million. The volume graph shows that the current volume is below the average volume line.
This month, the stock underperformed as it was down by 8.65% and 9.74% this week respectively. However, MU’s price was up by 10.46% over the last six months. Moreover, Micron Technology Inc. (NASDAQ: MU) stock’s year-to-date return is positive with an increase of 21.10% and its overall 1-year return was an increase of 7.70%.
At the time of writing, the market capitalization of MU stock is $67.06 Billion, and the total revenue is $30.76 Billion.
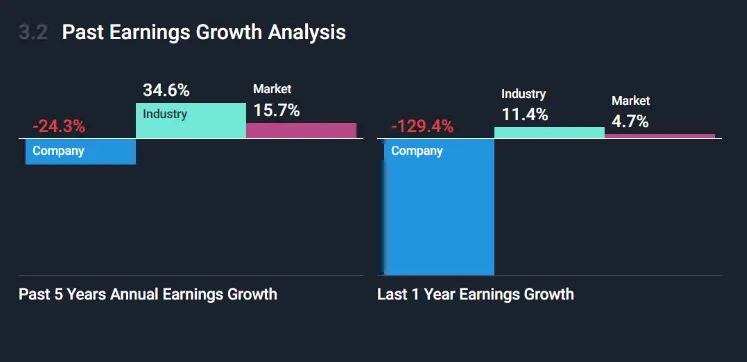
Micron Technology reported a drop in earnings by an average of -24.3% per year, while the earnings of the Semiconductor industry increased by 34.6% per year. The annual revenue growth rate has been -1% on average.
Micron Technology has $45.4 Billion in shareholder equity and $11.8 Billion in debt, which gives it a debt-to-equity ratio of 26%. The MU stock’s total assets are $65.7 Billion, and the stock’s total liabilities are $20.3 Billion.
Micron Technology Inc., Technical Analysis in 1-Dmeframe
As per the price action, it is observed that the Micron Technology Inc. price it is observed that stock price took a rebound from major support in March at $52.70, and within a span of three months, the stock price surged roughly 40% upwards by making higher highs and higher lows reaching $74.77 by the end of May.
However, from the start of the first week of May, the MU stock started to fall and moved in a channel by making lower lows and lower highs. By July 5th the price reached $61.98. The stock price is trying to sustain, but the bearish pressure might be too high as the price is below all major EMAs which are acting as hurdles, giving bearish views over the daily time frame chart.
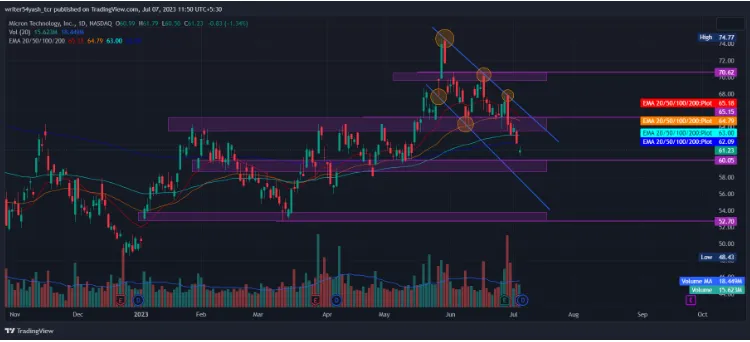
At the time of publishing, the Micron Technology Inc. price (NASDAQ: MU) price is trading below the 20, 50, 100, and 200-day EMAs (exponential moving averages), which is rejecting the price trend. Hence, the stock is expected to move downwards giving bearish views over the daily time frame chart.
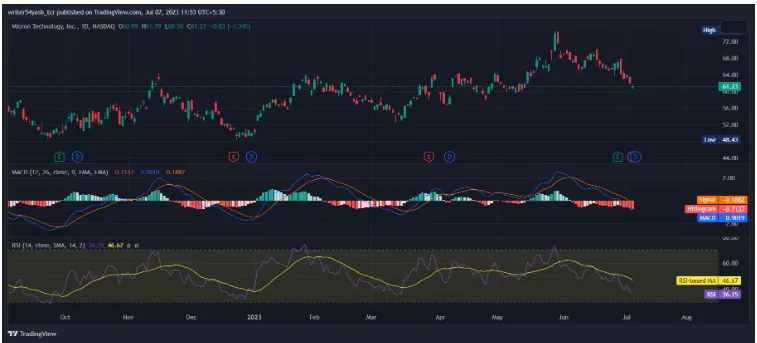
The MACD line at 0.9019 and signal line at 0.9019 is below the zero line but gave a bearish crossover, suggesting bearish signals. The current value of RSI is 36.15 points; it took rejection from the 14 SMA line and is headed downwards. The 14 SMA line is below the median line at 46.67 points which is in bearish territory below the median line which indicates bearishness ahead.
Summary
The Micron Technology Inc. price indicates that the sentiments and perspectives of investors and traders regarding the MU stock are bearish on the 1-day time frame. MU’s share price reflects pessimistic views at the moment. Moreover, the MU stock is in a bearish state as major indicators – MACD, RSI, and EMA, are giving bearish signals for the MU stock over the daily time frame.
Technical Levels:
- The nearest support: $60.05 and $52.70.
- The nearest resistance: $65.15 and $70.62.
Disclaimer
In this article, the views and opinions stated by the author or any people named are for informational purposes only, and they don’t establish the investment, financial, or any other advice. Trading or investing in cryptocurrency assets comes with a risk of financial loss.

Andrew is a blockchain developer who developed his interest in cryptocurrencies while pursuing his post-graduation major in blockchain development. He is a keen observer of details and shares his passion for writing, along with coding. His backend knowledge about blockchain helps him give a unique perspective to his writing skills, and a reliable craft at explaining the concepts such as blockchain programming, languages and token minting. He also frequently shares technical details and performance indicators of ICOs and IDOs.


