
 Home
Home News
News
- 1 The Sandbox (SAND) coin is trading at $0.415897 at press time with a nominal drop of -3.00% in the last 24 hours.
- 2 The SAND coin declined by -2.50% in the last 7 days.
- 2 Currently, the coin is experiencing a downward trend.
SAND coin investors are facing a tough time in the market. Investors lost about more than 95% of their invested capital and the hope of the investors is dying now. Based on the price data of the coin, it can be observed that it is in a massive downtrend. The price declined by -2.50% in the last seven days and we can say that the Sandbox coin didn’t perform well. It tanked -95.03% from its peak price of $8.40 in a span of 12 months. SAND Coin’s existing market sentiments are not exactly positive. Volume is low and as of now, there is hardly any buying pressure. Bears are overwhelming the market.
The Sandbox (SAND) Coin Technical Analysis
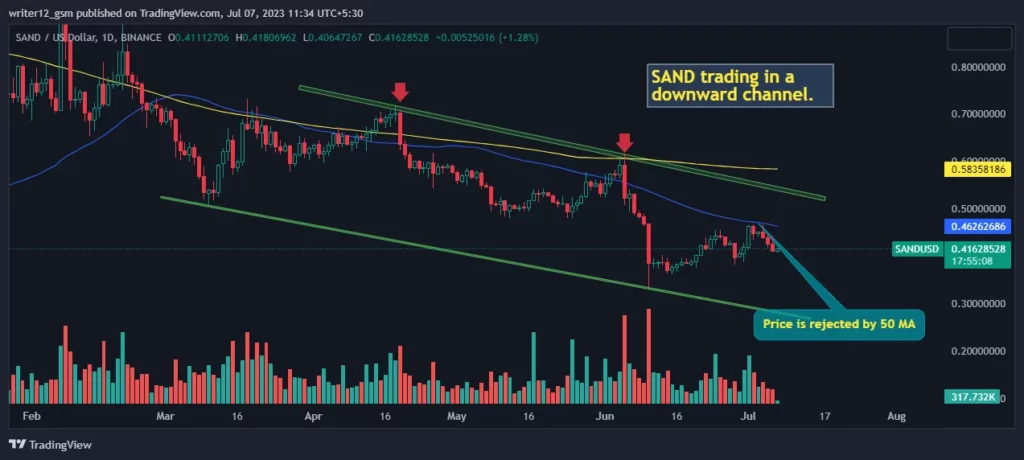
The SAND price has dropped below the 50 and 200 EMAs, which suggests that the price is in a bearish trend. If the sellers maintain the pressure, the coin’s value may drop even further in the forthcoming week. The bears are not in the mood to give power to bulls right now. A death cross was observed on the chart.
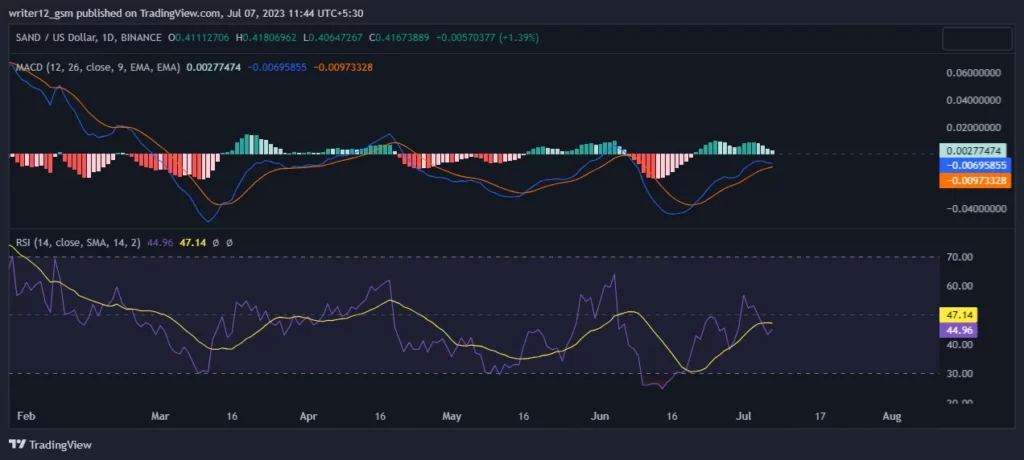
The MACD indicator also indicates a negative trend. The MACD line at -0.06983360 and signal line at -0.00973829 is below the zero line, suggesting that the MACD is in negative territory and is giving bearish signals.
The current value of RSI is 44.84 points. The 14 SMA line is currently close to the median line, around 47.13 points which indicates negative sentiment in the market. As the price is heading towards the overbought territory, the market encounters strong bullish sentiment.
Volume Analysis
The Sandbox coin’s average trading volume for the last 24 hours is $51,364,420. It is showing a -22.80% drop in volume in a day. SAND’s low volume is mainly due to a lack of buying interest among investors.
Summary
The Sandbox coin is struggling in the market. Based on the price action, it seems that a price break of its primary trendline support level may lead to further price drops in the upcoming days. The Sandbox coin’s price shows a pessimistic situation at the moment. The EMAs, the RSI, and the MACD gave negative signs about the coin. The coin is not showing any recovery signs right now.
Technical Levels:
- Support – The current support levels are $0.3297 and $0.295.
- Resistance –The current resistance levels are $ 0.508 and 0.579.
Disclaimer
The research given in this article is for informative and educational use only. Do not take this information as a financial or trading recommendation. Trading and investing have financial risks. Please consider your risk profile and circumstances before creating any investment or trading decision.

Nancy J. Allen is a crypto enthusiast, with a major in macroeconomics and minor in business statistics. She believes that cryptocurrencies inspire people to be their own banks, and step aside from traditional monetary exchange systems. She is also intrigued by blockchain technology and its functioning. She frequently researches, and posts content on the top altcoins, their theoretical working principles and technical price predictions.


