
 Home
Home News
News
- 1 Solana price is struggling to escape the resistance mark of $22.
- 2 Bulls are attempting to surpass the 200-day EMA.
Solana (SOL) price shows an ascending triangle pattern, leading to recovery from $13. SOL is now looking to surpass the pattern’s neckline above $22, which bulls have been trying to accomplish for the past three sessions.
Moreover, sellers maintained strong resilience at 200-day EMA while the bulls found it difficult to sustain on that range. Solana’s price is trading above the 20,50, and 100-day EMAs but facing the 200-day EMA as resistance, with buyers trying to escape from the previous trading sessions.
The price action showed that bulls made long positions during this ongoing bounce last week, and could produce a range breakout. Moreover, the chart structure reflects the neutral outlook because the price still trades below the buying region. If SOL manages to surpass $26, then it will enter into the buying range, where buyers get further strength.
Similarly, if SOL cannot escape the neckline and rejects the 200-day EMA on the lower sides, it will retest the zone of $20.
At the time of writing, Solana is trading at $21.77 with an intraday gain of 0.58%, signalling bullishness. Moreover, the trading volume showed an increase of 7.25% to $999.97 Million marking an uptick in investor interest. The pair of SOL/BTC is at 0.000719 BTC, and the market cap of SOL is $8.76 Billion.
Daily Charts Shows Bulls’ Strength
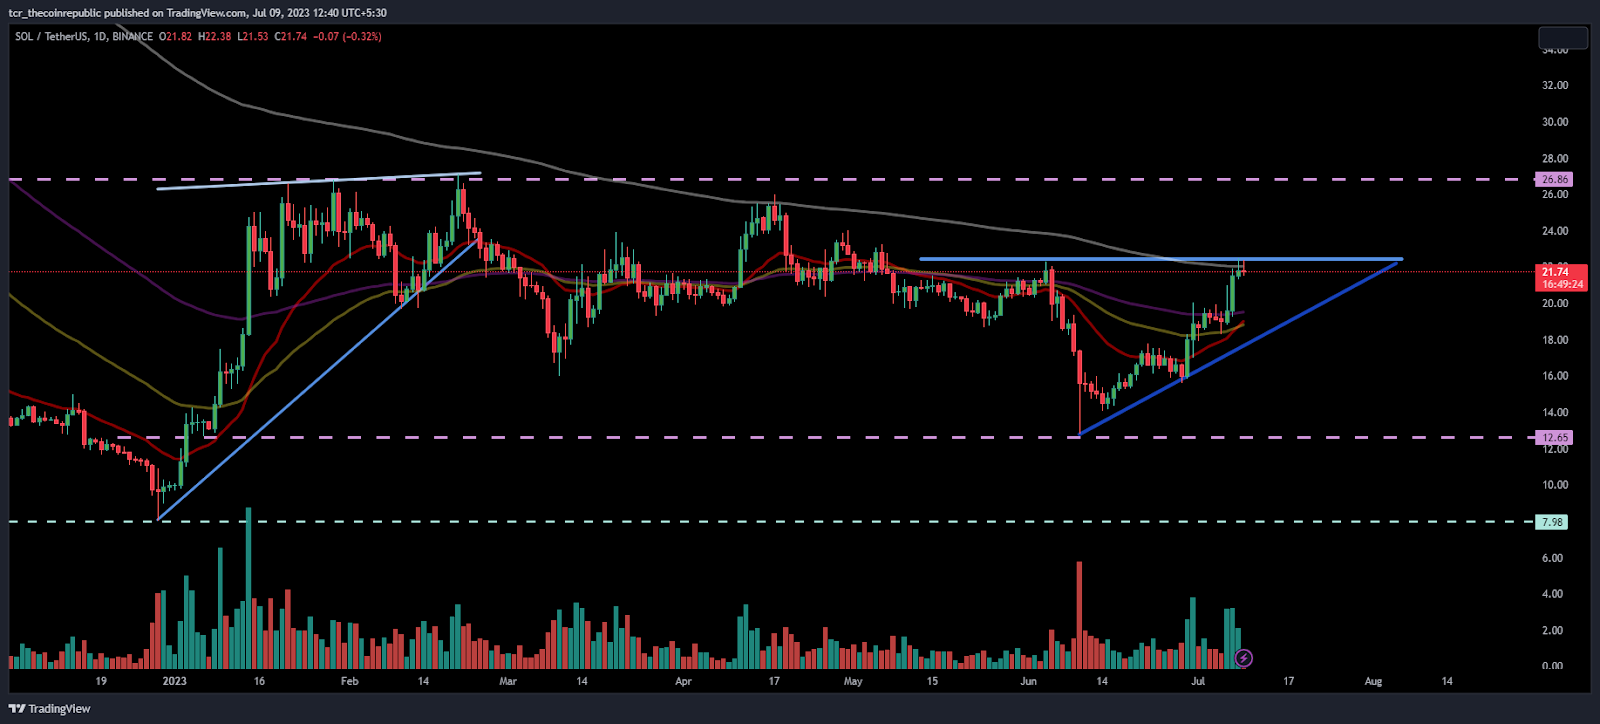
On the daily charts, SOL price is trading near the neckline of the ascending triangle pattern and attempting to surpass it. However, the 200-day EMA acts as a barrier, leading to a rejection and the formation of an inverted hammer candlestick.
As per the technicals, SOL could succeed in surpassing $23, which would only set off another rally. Furthermore, the price is above the 61.8% Fib level, showing bulls’ strength on the charts.
What Technical Indicators Say?
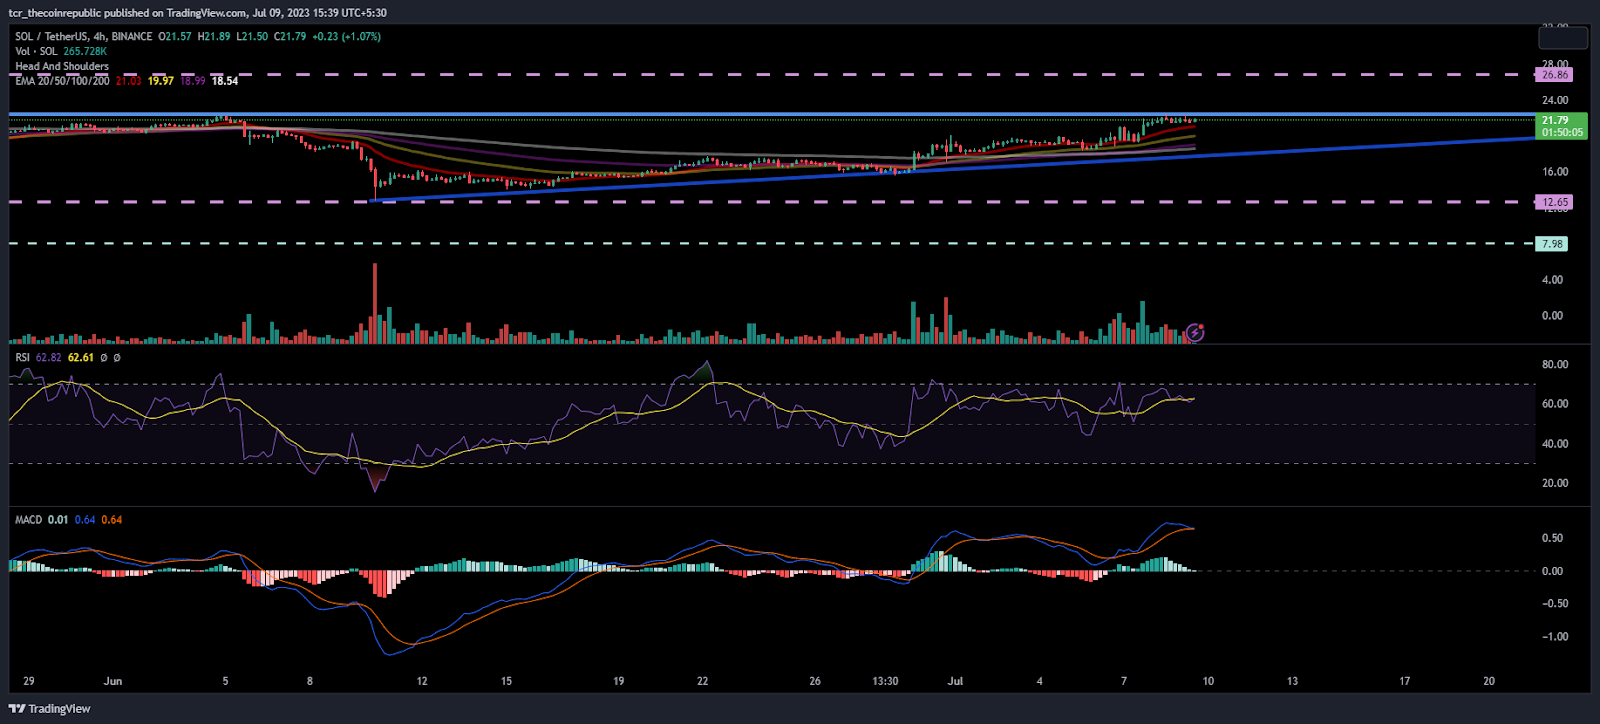
On the 4-hour charts, SOL continued to form higher highs and is near a make-or-break move. If it surpasses the 200-day EMA, it will lead to bullishness that will head toward $25. On the other hand, if there’s a rejection, it would signal bearishness.
The RSI curve near 60 in the overbought zone showed a positive crossover in the last trading session and indicated bullish sentiments.
The MACD indicator persisted in forming green bars, and a bullish crossover was noted in the previous sessions, which signalled that buyers were showing their presence over the charts.
Conclusion:
Solana (SOL) price is near the 200-day EMA and is willing to surpass that level to extend the reversal move.
Technical Levels
Support Levels: $20
Resistance Levels:$25
Disclaimer
The views and opinions stated by the author, or any people named in this article, are for informational purposes only and do not establish financial, investment, or other advice. Investing in or trading crypto assets comes with a risk of financial loss.

Andrew is a blockchain developer who developed his interest in cryptocurrencies while pursuing his post-graduation major in blockchain development. He is a keen observer of details and shares his passion for writing, along with coding. His backend knowledge about blockchain helps him give a unique perspective to his writing skills, and a reliable craft at explaining the concepts such as blockchain programming, languages and token minting. He also frequently shares technical details and performance indicators of ICOs and IDOs.


