
 Home
Home News
News
Litecoin price bounced from its 50-day EMA, forming a hammer candle in the last session as the buyers accumulate. The chart structure is giving a positive outlook in the bulls’ favor.
The ongoing trend of LTC shows that the coin has ended its correction phase and revamped from the support of $80. Afterward, buyers gained traction and looked to escape $100, which reacted as a barrier from the past sessions. Sellers maintain a firm grip and do not permit buyers to grab that region.
The price action indicates that the battle between buyers and sellers is exciting, and the price is near a make-or-break level.
LTC was consolidating in a narrow range below $100 in the previous months but held gains above $80 for many days. Afterward, the range’s neckline was broken again, and buyers tried to spread the gains further.
However, LTC has gained momentum and is looking to defeat bears to enter the fresh buying zone. The trajectory of LTC suggests that above $105, buyers will gain strength and head into an uptrend. On the other hand, if rejection occurs below $92, sellers will again short the coin.
At the time of writing, LTC is trading at $97.52 with an intraday gain of 2.75%, bouncing off the 50-day EMA. Moreover, the trading volume surged with a massive spike of 9.20%, indicating that bulls are gaining strength. The pair of LTC/BTC is at 0.00320 BTC.
Daily Chart Structure of LTC
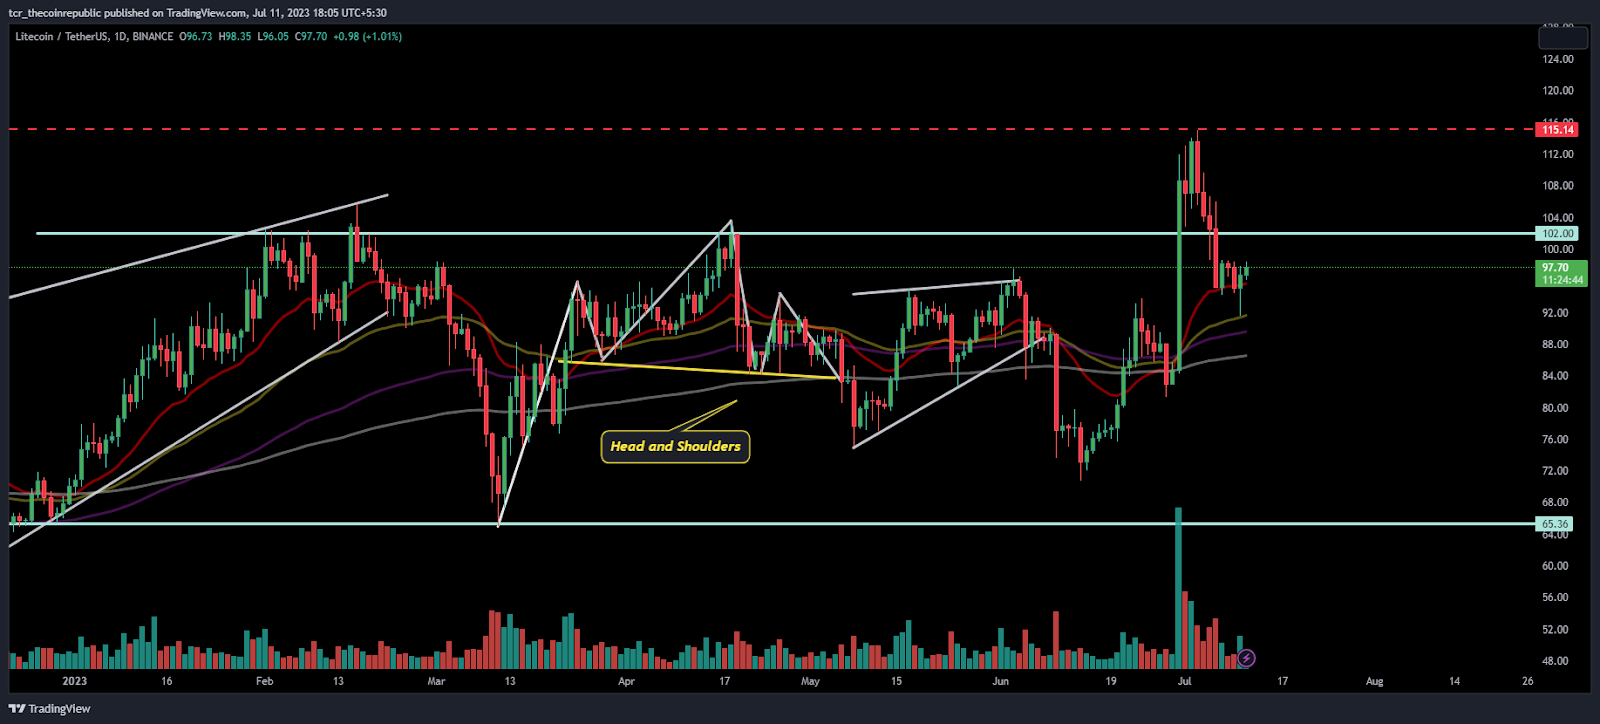
Recently, LTC escaped above the hurdle and reached $115, where the rebound halted, and the price again retraced below $100, where the price jumped from the 50-day EMA.
As per the Fib levels, the LTC price is near the 50% level, which acts as a support, and the price is headed toward the 61.8% level, which is at $104.
If LTC gains traction and escapes above $100, the momentum will rise further, and the bulls will extend the ongoing rebound rally to $115 to retest.
What the Technical Indicators Say
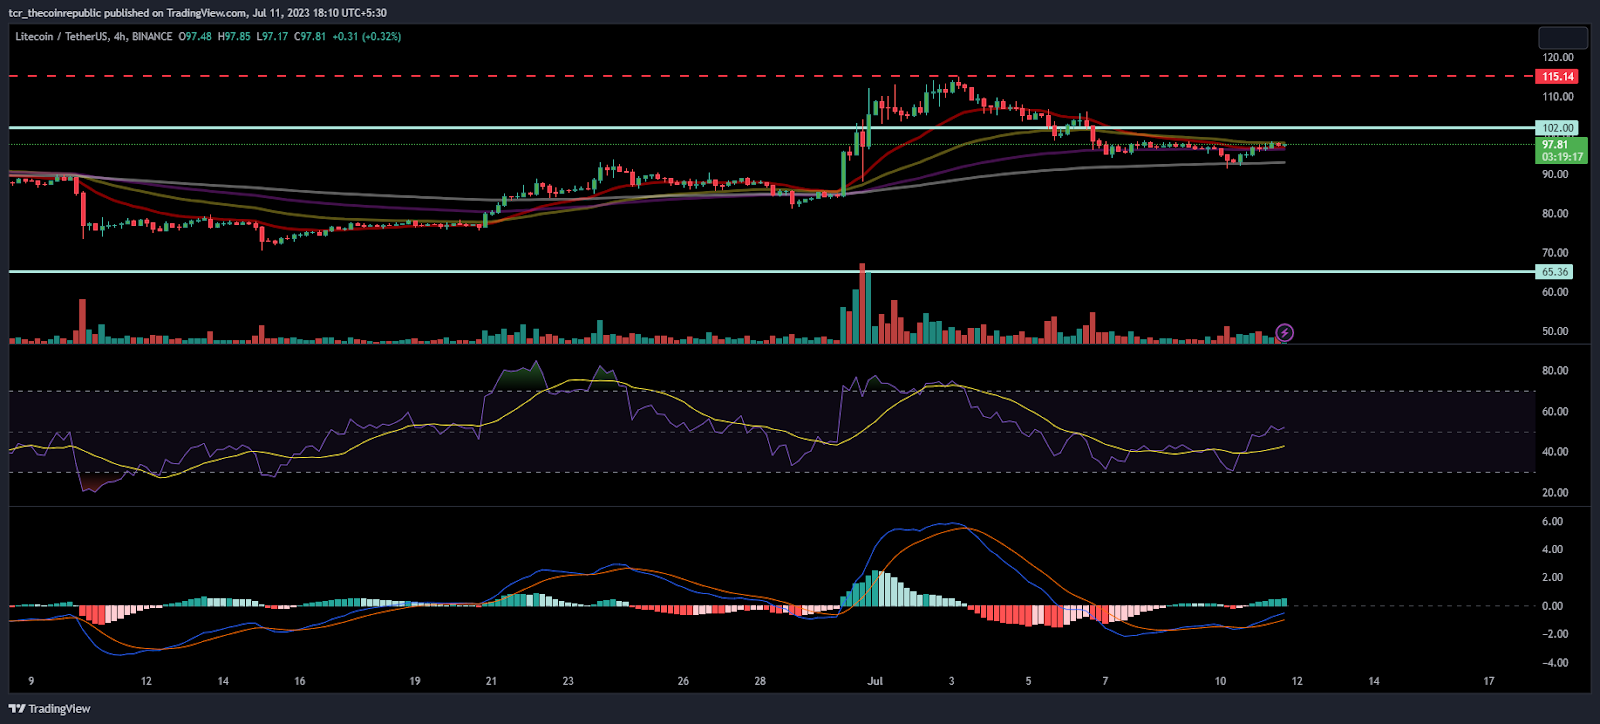
On the 4-hour chart, LTC gained momentum and increased the gains indicating buyers’ dominance. Furthermore, the chart shows that sellers were trapped and were covering their positions, leading to a rebound from $90.
The RSI showed a reversal from the oversold region and is near 50 showing neutrality on the charts.
The MACD indicator shows green bars on the histogram showing a bullish crossover signalling a reversal.
Conclusion:
Litecoin price initiated a fresh reversal from the support, looking to beat the ongoing hurdles above $100.
Technical Levels
Support Levels:$85 and $78
Resistance levels: $100 and $110
Disclaimer
The views and opinions stated by the author, or any people named in this article, are for informational purposes only and do not establish financial, investment, or other advice. Investing in or trading crypto assets comes with a risk of financial loss.

Nancy J. Allen is a crypto enthusiast, with a major in macroeconomics and minor in business statistics. She believes that cryptocurrencies inspire people to be their own banks, and step aside from traditional monetary exchange systems. She is also intrigued by blockchain technology and its functioning. She frequently researches, and posts content on the top altcoins, their theoretical working principles and technical price predictions.


