
 Home
Home News
News
- 1 BCH price showed a massive upswing in the past few trading sessions.
- 2 Bulls held their gains showing their dominance.
Bitcoin Cash (BCH) noted a massive rally after listing on the EDX market in June. Afterward, most short sellers were cautious because of the massive spike of 150% in the last 20 trading sessions, and buyers were unwilling to pause.
The bulls find it challenging to escape the supply zone of $300 and are trading below it.
However, the BCH price is now consolidating over the top and forming a symmetrical flag pattern which shows an upcoming bullish signal. If the price escapes $290, momentum will rise, and further buying can be seen.
The price action shows BCH is trading in a strong uptrend and uncharted territory, and further rally can be extended if the neckline of $290 breaks.
Furthermore, BCH price trades in the bullish territory and above the significant moving averages. In contrast, the sellers are trying to force towards a 20-day EMA. BCH price is still trading in a rising channel and is waiting for a range breakout above $300.
At the time of writing, BCH price is trading at $285.23 with an intraday gain of 3.24%, showing bullishness on the charts. Furthermore, the intraday trading volume increased by 12.56% to $702.53 Million, The pair of BCH/BTC is at 0.00938 BTC, and the market cap is $5.46 Billion.
Daily Charts Shows Rising Action on the BCH Chart
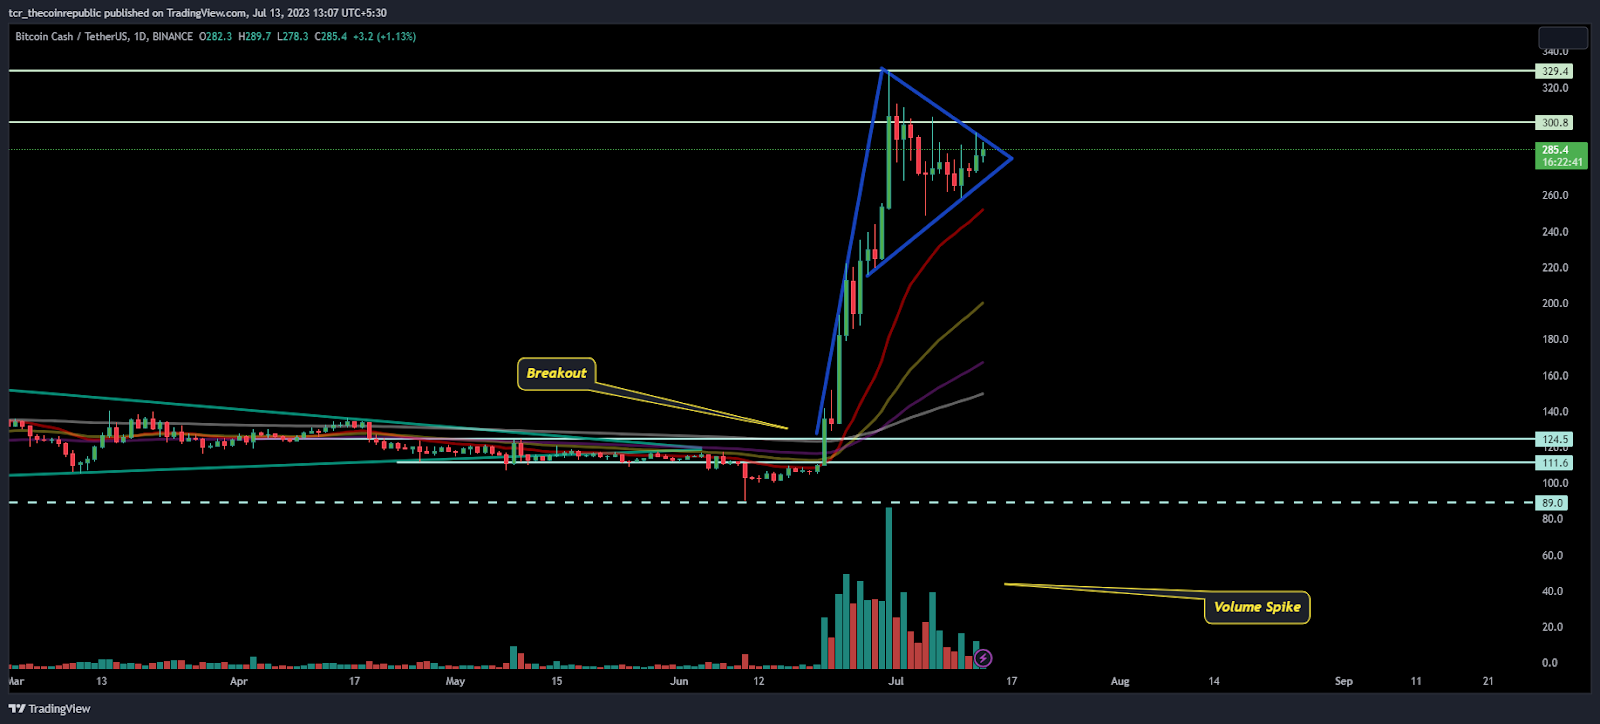
On the daily charts, BCH price is trading in a narrow range and waiting for to escape the hurdle of $300. Moreover, the flag pattern indicates buyers are accumulating the coin and attempting a range breakout. Furthermore, the technical parameters also show bullishness on the charts.
As per the Fib levels, BCH price is trading above 61.8% and could retest $280. However, the bollinger band is spreading, and further consolidation could be seen in the upcoming sessions.
Short Term Charts Show Consolidation
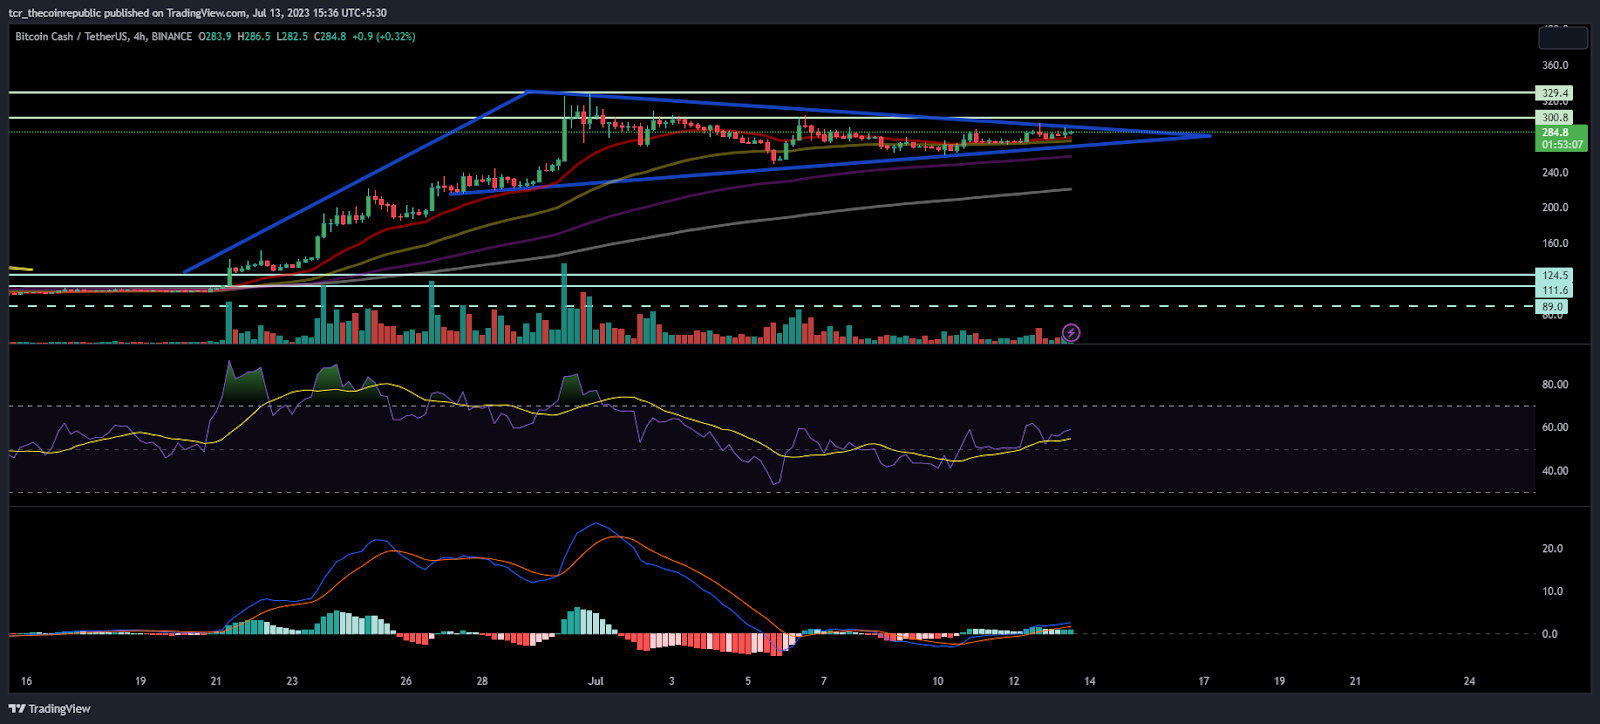
On the 4-hour charts, the BCH price is consolidating, and bulls and bears are waiting for a decisive effort to leave the cage.
The RSI curve is floating near the neutral range and shows sideways price action, which does not indicate decisive moves.
The MACD indicator is also moving flat, and the moving averages are converging, offering a range-bound BCH movement.
Conclusion:
BCH price is trading above key moving averages, and holds the gains on the top as the previous trading sessions were bullish. Moreover, the buyers have a decisive edge in leading the gains.
Technical Levels:
Support Levels: $275
Resistance Levels:$300
Disclaimer
The views and opinions stated by the author, or any people named in this article, are for informational purposes only and do not establish financial, investment, or other advice. Investing in or trading crypto assets comes with a risk of financial loss.

Adarsh Singh is a true connoisseur of Defi and Blockchain technologies, who left his job at a “Big 4” multinational finance firm to pursue crypto and NFT trading full-time. He has a strong background in finance, with MBA from a prestigious B-school. He delves deep into these innovative fields, unraveling their intricacies. Uncovering hidden gems, be it coins, tokens or NFTs, is his expertise. NFTs drive deep interest for him, and his creative analysis of NFTs opens up engaging narratives. He strives to bring decentralized digital assets accessible to the masses.


