
 Home
Home News
News
- 1 The Riot Platforms Inc (NASDAQ: RIOT) stock price is trading at $17.65 currently with a market capitalization of $3.266 Billion.
- 2 RIOT stock price observed a massive jump of 37.68% over the last 7 days.
Riot Platforms Inc (RIOT) is impressing everyone with its excellent performance. It is making higher highs and maintaining its momentum. RIOT has touched $18.64 from the low price of $3.25 in 52 weeks. Its profit margin is -238.23% and its average volume for the past 3 months is 23.24 Million.
Riot Platforms Inc stock price skyrocketed on the daily time frame, showing extremely bullish signals. The price has already broken the 50- and 200-days moving averages and is making higher highs.
Riot Platforms has a market cap of $3.004 Billion, a beta value of 4.19, and an earnings per share of -4.67. Riot Platforms has a revenue of $73.24 Million, a net income of -$55.69 Million, a net profit margin of -76.04%, and an EBITDA of -$7.03 Million.
The company also has cash and short-term investments of $158.27 Million, total assets of $1.25 Billion, total liabilities of $158.17 Million, and total equity of $1.09 Billion. Its price to book ratio is 2.58, its return on assets is -12.91%, and its return on capital is N/A.
Weekly Analysis of RIOT Stock
When we take a close look at the weekly time frame, Riot Platforms Inc’s stock price has surpassed the 50 and 200-days moving averages, indicating the bulls are back in business. RIOT price has breached the 200-days moving average with a strong marubozu candle, indicating that the trend has turned bullish. Moreover, RSI and MACD are also extremely bullish on the weekly time frame.
RIOT Stock Price Technical Analysis
The price of Riot Platforms Inc (RIOT) has jumped above the 200-day and 50-day moving averages showing the influence of buyers in the market. However, if buyers continue to push harder, RIOT stock price can grow further and go into an uptrend. Moreover, the bullish cross confirms the bullish trend.
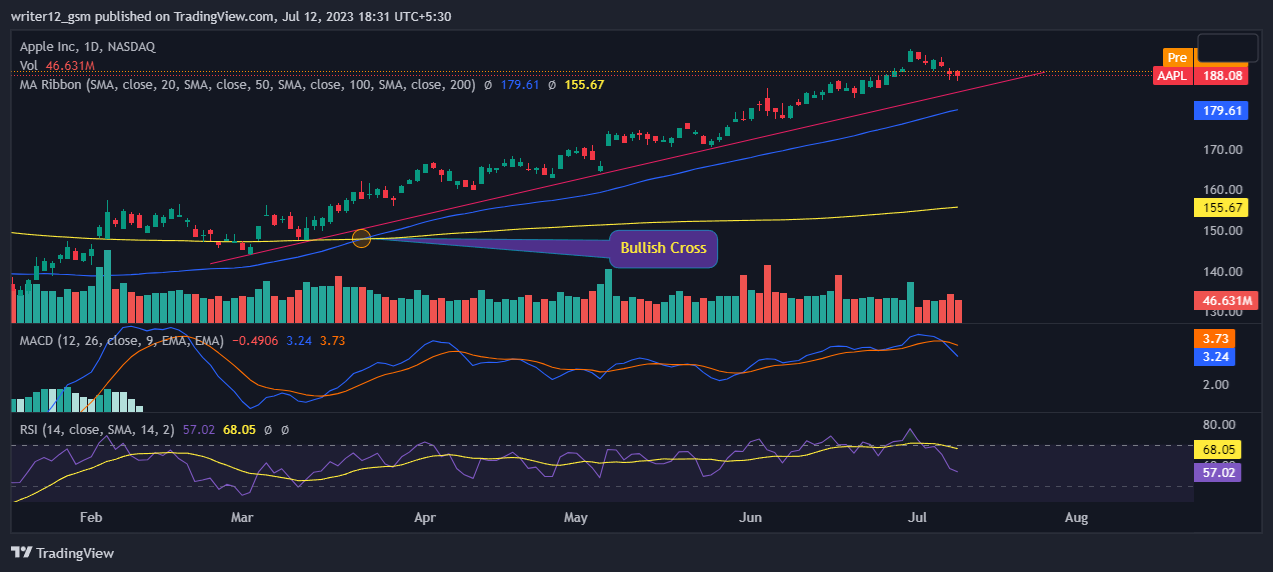
The RSI has been trading close to the oversold area. The RSI line is around 80.88. The 14 SMA line has a value of 63.75 points which indicates that Riot Platforms Inc’s price is in the positive area and is extremely bullish.
Right now, MACD is giving bullish signals. The MACD line at 1.50 and the signal line at 0.8197 is above the zero line, suggesting that the MACD is in positive territory and is giving positive signals as of now.
Conclusion
Based on the current chart, the market is trading above the bullish moving average crossover and the RSI is also supporting by remaining above the 50 level. The MACD has given a bearish signal but it is also in the bullish territory, which indicates a short-term retracement in the stock. Thus, Riot Platforms Inc stock appears positive, based on the charts and higher prices can be anticipated in the upcoming days.
Technical Levels:
- Support – The current support level is $15.
- Resistance –The current resistance level is $20.
Disclaimer
The analysis given in this article is for informational and educational use only. Do not use this information as financial, investment, or as trading advice. Investing and trading in stock is a risky task. Please consider your circumstances and risk profile before making any investment decisions.

Andrew is a blockchain developer who developed his interest in cryptocurrencies while pursuing his post-graduation major in blockchain development. He is a keen observer of details and shares his passion for writing, along with coding. His backend knowledge about blockchain helps him give a unique perspective to his writing skills, and a reliable craft at explaining the concepts such as blockchain programming, languages and token minting. He also frequently shares technical details and performance indicators of ICOs and IDOs.


