
 Home
Home News
News
- 1 XDC price prediction is currently at $0.031 (press time); XDC is down by 1.84% in the last 24 hours.
- 2 XDC recorded an 11.96% decline in 24-hour trading volume.
XDC Network price prediction is suggesting that the XDC token is presently moving near the demand zone on an uptrend in the daily timeframe. However, the price of XDC crypto is trading above the critical EMAs on the daily timeframe. The price action indicates that sellers presently have a stronghold over the market though according to historical price action the price has been respecting the trendline for the past 8 months and it is yet to close above it.
If the buyers are able to breach the 200 EMA barrier and sustain the price above it, the value of the XDC token could see a substantial rise in its value within the next few weeks. If the XDC network breaks above its critical resistance level, it can surge up by 21% within the next few days.
Despite the adequate target, the Investors may prefer to wait for a bullish engulfing candle and a breakout that multiple technical indicators indicate before stepping in the price action. As there is a possibility that the price can break below its present support zone if it does not gain sufficient backing from the buyers.
The present value of XDC is $0.31 and it has a market capitalization of around $438.38 Million (press time).
Significant Surge In Social Engagement Levels: XDC Network
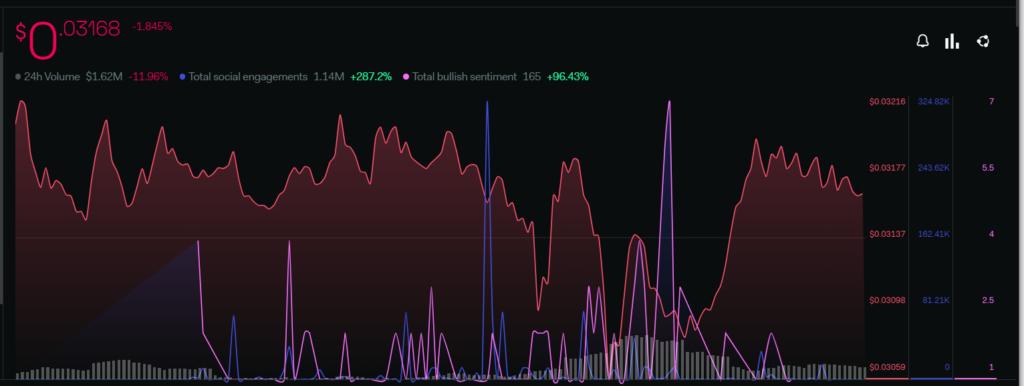
The total engagement level and bullish sentiment of the buyers are rising significantly on the weekly chart on the LunarCrush platform. The increase in these parameters suggests that the community is bullish and gaining interest in the token.
The total bullish sentiment metric increased by 96.43%, whereas the total social engagement level is up by 287.2% which suggests that despite the recent decline, the community is active regarding the token across various social media platforms.
XDC Network Price Prediction: Technical Analysis On 1 Day Timeframe
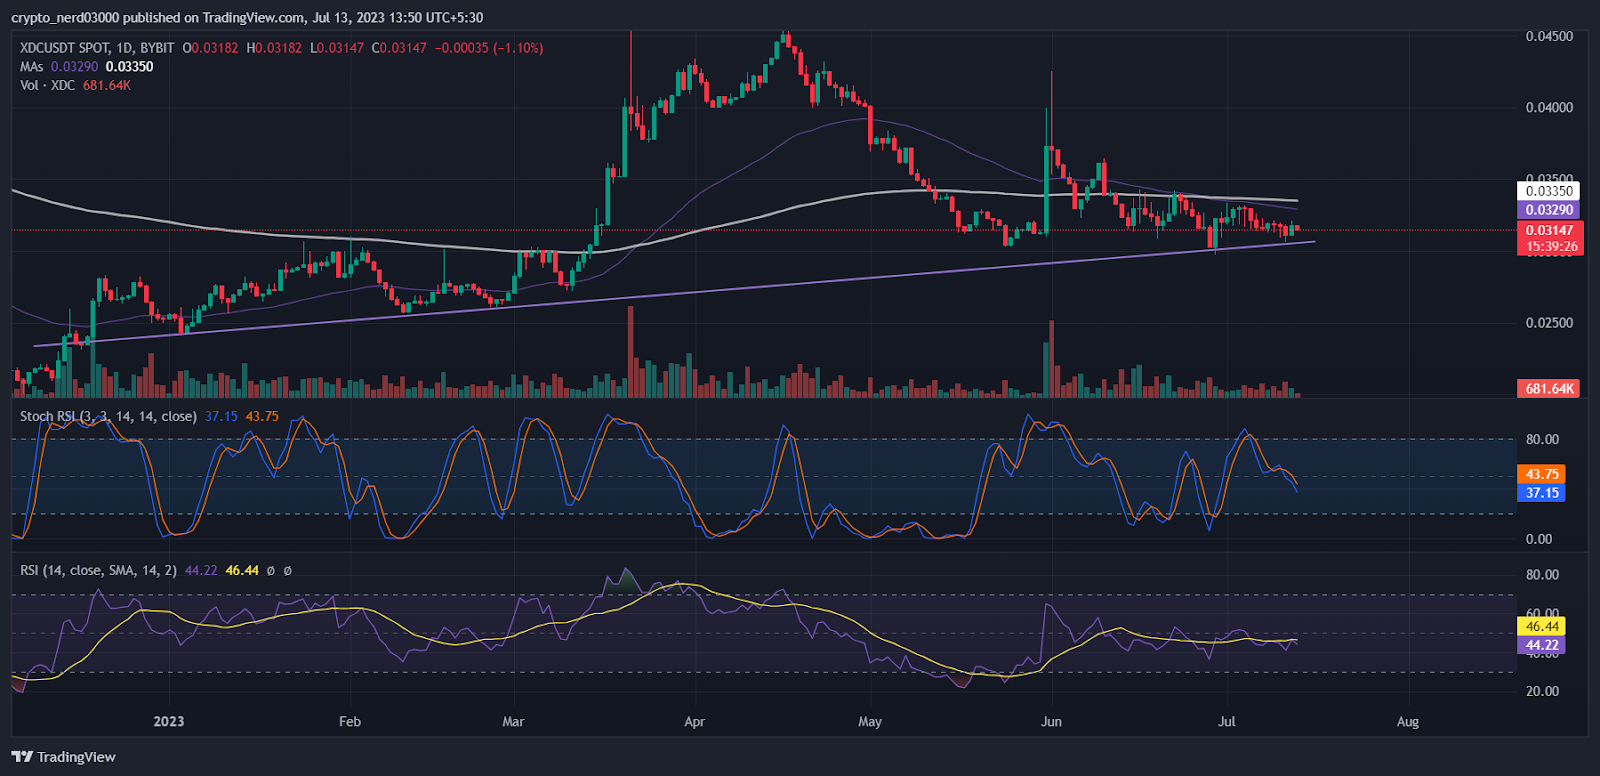
The RSI oscillator has been moving below the median line for the past few months. The current value of RSI is 44.22 points, whereas the 14 SMA is providing resistance to it at 46.44 points. It could see a further increase in value shortly.
The stochastic RSI line has approached the neutral zone on the one-day chart. The value of the stochastic RSI is 37.15 points.
Conclusion
As per the analysis, XDC Network price prediction is suggesting that XDC token is presently moving near the demand zone which may attract more buyers to step into the price action.
Technical levels –
Support – $0.020
Resistance – $0.035 and $0.040
Disclaimer
The views and opinions stated by the author, or any people named in this article, are for informational purposes only, and they do not establish financial, investment, or other advice. Investing in or trading crypto assets comes with a risk of financial loss.
Mr. Pratik chadhokar is an Indian Forex, Cryptocurrencies and Financial Market Advisor and analyst with a background in IT and Financial market Strategist. He specialises in market strategies and technical analysis and has spent over a year as a financial markets contributor and observer. He possesses strong technical analytical skills and is well known for his entertaining and informative analysis of the Financial markets.


