
 Home
Home News
News

- 1 AMC Entertainment Holdings, Inc. (NYSE: AMC) stock price is trading at $4.4000 currently with a market capitalization of $4.247 Billion.
- 2 AMC stock price observed a decrease of 0.90% over the last 7 days.
AMC stock has made lower lows and its downward momentum seems to have accelerated. AMC has taken a pause recently and is trying to breach the 50-moving average. However, it has faced rejection from the resistance line.
By evaluating the price trend of AMC stock, it can be said that it has been in a downtrend over the past few trading sessions. The net profit margin of the stock is -21.37%, which is lower that industry average. This implies that AMC is not performing well right now.

From its 52-week high price of $27.50, it has fallen to its current price of $4.40 (press time). The stock has total assets of $6.58 Billion, total liabilities of $5.08 Billion, total equity of $1.49 Billion, a price to book of -3.72, a return on equity of -65.4%, and a return on assets of -14.8%.
AMC stock has delivered poor returns to investors. The current market sentiments are not favorable for the stock. The average three-month volume for AMC is $17.4 Million. Investors are showing interest in the stock in the present market scenario.
AMC Stock Price Technical Analysis
The price of AMC Entertainment Holdings, Inc. (AMC) has been trading below the 50-day and 200-day moving averages and was rejected by the upper resistance level. However, if sellers continue to push the market lower, AMC stock prices can drop more.
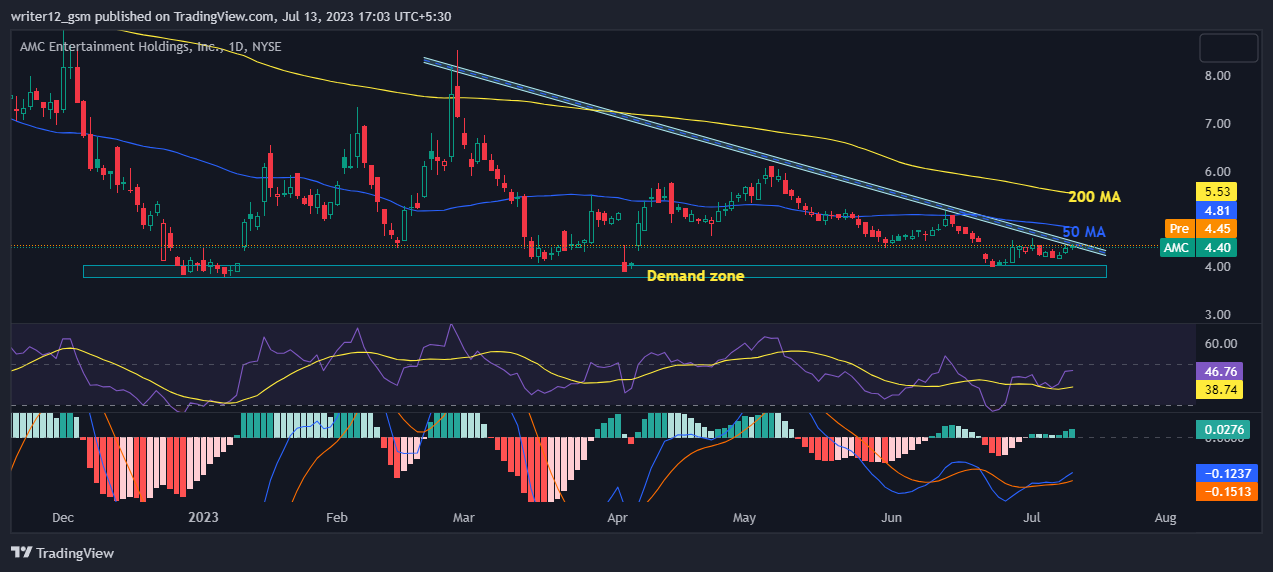
The RSI has been trading close to the median area. The RSI line is around 46.76. The 14 SMA line has a value of 38.74 points which indicates that the AMC Entertainment Holdings, Inc. AMC Entertainment Holdings, Inc. price is in the neutral area.
The MACD line at -0.1237 and the signal line at -0.1513 is below the zero line, suggesting that the MACD is in negative territory and is giving negative signals as of now.
Conclusion
The current market sentiments are negative about the stock price as it is near a critical support level. The share price of AMC Entertainment Holdings, Inc. is declining in the market. The price action suggests that the price may decline further in the upcoming days if it breaks the primary trendline support level. AMC’s price reflects a bearish scenario at the moment. Major reliable indicators like EMA, RSI, and MACD are giving bearish signals about AMC stock. The current scenario requires traders and investors to be patient and look for a clear break below or above the range before making any moves, avoid FOMO, and minimise losses.
Technical Levels:
- Support – The current support level is $99.40.
- Resistance –The current resistance level is $105.86.
Disclaimer
The analysis given in this article is for informational and educational use only. Do not use this information as financial, investment, or as trading advice. Investing and trading in stock is a risky task. Please consider your circumstances and risk profile before making any investment decisions.
Mr. Pratik chadhokar is an Indian Forex, Cryptocurrencies and Financial Market Advisor and analyst with a background in IT and Financial market Strategist. He specialises in market strategies and technical analysis and has spent over a year as a financial markets contributor and observer. He possesses strong technical analytical skills and is well known for his entertaining and informative analysis of the Financial markets.


