
 Home
Home News
News
- 1 The Snap Inc. (SNAP) stock price is trading at $13.51 currently with a market capitalization of $21.64 Billion.
- 2 SNAP stock price observed an impressive jump of 10.41% over the last 7 days.
Snap Inc. (SNAP) impressed everyone with its excellent performance. It is making higher highs and keeping its momentum. SNAP touched the $16.55 mark from the low of $7.33 in 52 weeks. Its average volume for the past 3 months is 27.39 Million.
Snap Inc. stock price took off on the daily time frame, giving extremely bullish signals. The price has been making higher highs and broke the 50- and 200-day moving averages.

SNAP has a market capitalization of $21.063 Billion. However, the financial performance of 2022 was disappointing. It reported a revenue of $4.60 Billion with a negative net income of -$1.43 Billion and a negative profit margin of -31.07%. The company has a debt of $4.18 Billion with a free cash flow of $124.19 Million and cash & equivalents of $1.42 Billion. This shows that the company is struggling to generate profits and has a high debt burden.
Weekly Analysis of SNAP Stock
A closer look at the weekly time frame shows that Snap Inc. stock price surpassed the 50 days moving average, indicating the bulls are trying to bounce back. SNAP price indicated that the trend has turned bullish. Moreover, the RSI and MACD are also bullish on the weekly time frame.
SNAP Stock Price Technical Analysis
The price of Snap Inc (SNAP) has jumped above the 200-day and 50-day moving averages showing the influence of buyers in the market. However, if the buyers continue to push harder, SNAP stock price can grow further and could go into an uptrend. Moreover, the bullish cross verifies the bullish trend on a daily time frame.
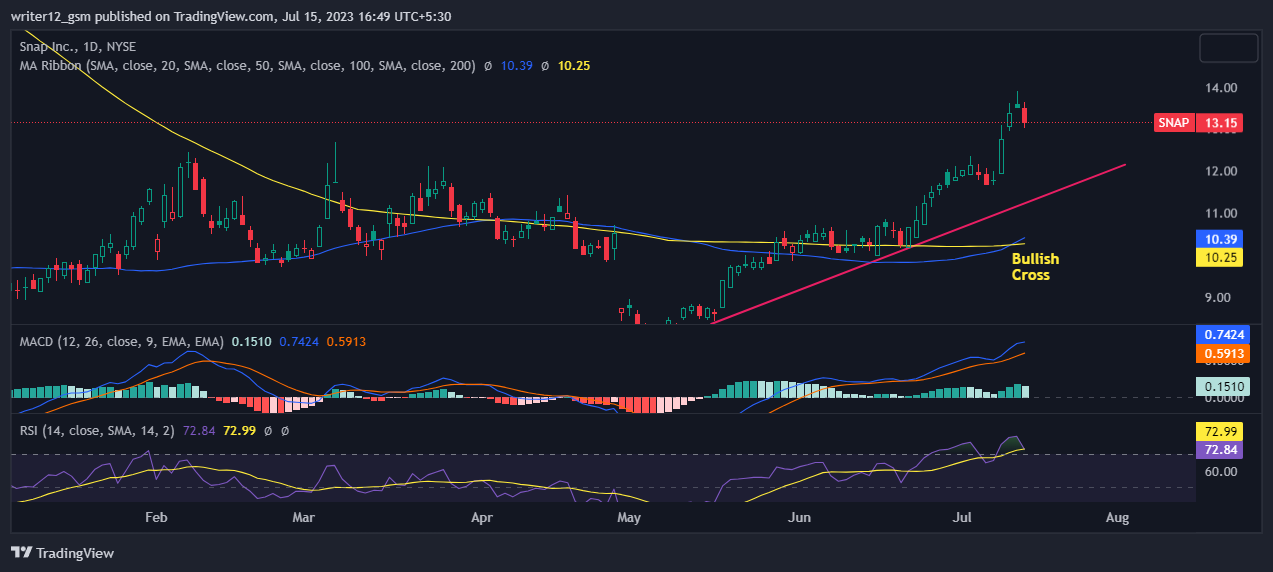
The RSI has been trading near the oversold zone. The RSI line is around 72.84. The 14 SMA line has a value of 72.84 points which indicates that Snap Inc.’s price is in the positive area and is extremely bullish.
Right now, MACD is giving bullish signals. The MACD line at 0.7424 and the signal line at 0.5913 are above the zero line, suggesting that the MACD is in positive territory and is giving positive signals as of now.
Conclusion
Snap Inc. (SNAP) is showing remarkable performance and momentum in the market. It is making higher highs and breaking the 50- and 200-days moving averages on both daily and weekly time frames. The price, RSI, and MACD are all bullish, indicating a strong uptrend and a positive outlook. However, the company has poor financial performance – negative net income and profit margin. The company also has a high debt burden. Snap Inc. (SNAP) could be a risky stock for investors who are looking for profitability.
Technical Levels:
- Support – The current support level is $12.69.
- Resistance –The current resistance level is $16.55.
Disclaimer
The analysis given in this article is for informational and educational use only. Do not use this information as financial, investment, or as trading advice. Investing and trading in stock is a risky task. Please consider your circumstances and risk profile before making any investment decisions.

Andrew is a blockchain developer who developed his interest in cryptocurrencies while pursuing his post-graduation major in blockchain development. He is a keen observer of details and shares his passion for writing, along with coding. His backend knowledge about blockchain helps him give a unique perspective to his writing skills, and a reliable craft at explaining the concepts such as blockchain programming, languages and token minting. He also frequently shares technical details and performance indicators of ICOs and IDOs.


