
 Home
Home News
News
- 1 The Uber Technologies, Inc. (UBER) stock price is trading at $44.75 currently with a market capitalization of $90.566 Billion.
- 2 UBER stock price observed a jump of 6.37% over the last 7 days.
Uber Technologies, Inc. is making higher highs and maintaining its momentum. UBER touched the $46.40 level from the low price of $22.11 in 52 weeks. Its average volume for the past 3 months is 24.64 Million.
Uber Technologies, Inc.’s stock price performed bullishly on the daily time frame, showing extremely bullish signals. The price has been making higher highs and is above the 50- and 200-days moving averages.

UBER has a market capitalization of $90.566 Billion. 2022 was not exactly a pleasant year for UBER. For 2022, it reported a revenue of $31.88 Billion with a negative net income of -$9.14 Billion and a negative profit margin of -28.68%. The company has a debt of $11.72 Billion with a free cash flow of $605.00 Million and cash & equivalents of $4.89 Billion. This shows that the company is struggling to generate profits and has a high debt burden.
Weekly Analysis of UBER Stock
On the weekly time frame, Uber Technologies, Inc’s stock price has surpassed the 50 and 200 days moving averages, indicating the bulls are in power. UBER price has indicated that the market has bullish sentiments. Moreover, RSI and MACD are also bullish on the weekly time frame.
UBER Stock Price Technical Analysis
The price of Uber Technologies, Inc. (UBER) has jumped above the 200-day and 50-day moving averages showing the influence of the buyers in the market. However, if buyers continue to push harder, UBER stock price could grow further and into an uptrend. Moreover, the bullish cross verifies the bullish trend on a daily time frame.
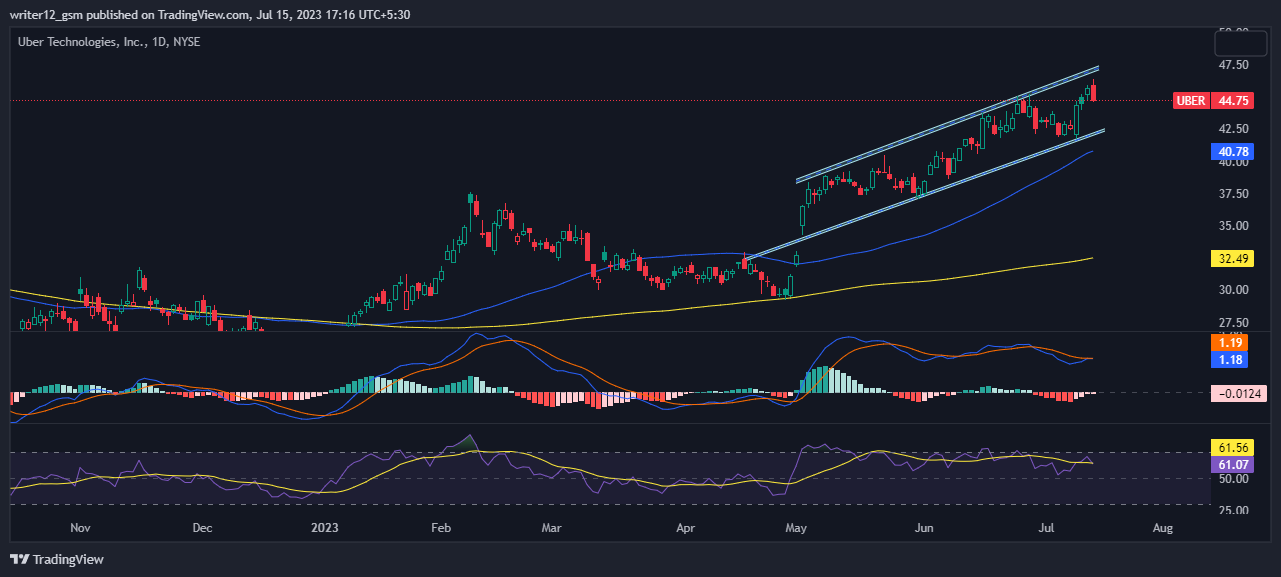
The RSI has been trading near the oversold zone. The RSI line is around 61.07. The 14 SMA line has a value of 61.56 points which indicates that Uber Technologies, Inc.’s price is in the positive area and is extremely bullish.
Right now, MACD is giving bullish signals. The MACD line at 1.18 and the signal line at 1.19 is above the zero line, suggesting that the MACD is in positive territory and is giving positive signals as of now.
Conclusion
Uber Technologies, Inc. is showing remarkable performance and momentum in the market. It is making higher highs and breaking the 50- and 200-days moving averages on both daily and weekly time frames. The price, RSI, and MACD are all bullish, indicating a strong uptrend and a positive outlook. However, the company reported negative net income and profit margin for the last financial year. The company has a high debt burden. UBER is a relatively risky stock for investors who are looking for profitability.
Technical Levels:
- Support – The current support level is $42.00.
- Resistance –The current resistance level is $48.00.
Disclaimer
The analysis given in this article is for informational and educational use only. Do not use this information as financial, investment, or as trading advice. Investing and trading in stock is a risky task. Please consider your circumstances and risk profile before making any investment decisions.
Steve Anderson is an Australian crypto enthusiast. He is a specialist in management and trading for over 5 years. Steve has worked as a crypto trader, he loves learning about decentralisation, understanding the true potential of the blockchain.


