
 Home
Home News
News
- 1 DHI stock grew sharply, making new highs every day.
- 2 Bulls are gaining extreme momentum as the sellers lose their grip.
D.R. Horton (NYSE: DHI) stock showed a massive rally and continued rising from the past months. The rising action shows that buyers have accumulated the stock, and that demand for the stock is growing with the incremental, but steady movement of the price.
A recent surge in the form of the ‘three white soldiers’ pattern with a bullish marubozu candle which means that investors have generated significant traction in the stock. Furthermore, the stock is trading far away from its key moving averages.
The chart shows a rising parallel channel, and price rise surges inside it. Moreover, the bullishness is at a peak, and a major short-covering move was noted on the charts. DHI stock will release its earnings report for Q3 2023 this week; the stock is rallying running up to the event.
D.R. Horton is a leading homebuilder in the United States, operating in 98 markets across 31 states. D.R. Horton mainly builds single-family detached homes (over 90% of home sales revenue) and offers products to entry-level, move-up, luxury buyers, and active adults.
The company offers homebuyers mortgage financing and title agency services through its financial services segment. D.R. Horton’s headquarters are in Arlington, Texas, and it manages six regional segments across the United States.
At press time, DHI stock was trading at $130.31 with an intraday gain of 3.04%, showing a bull move in the Friday market session. Moreover, the trading volume increased by 3.22% to 4.271 Million.
As per the stock technicals, Analysts maintained a strong buy rating, and the stock rewarded its investors by giving plenty of gains in a very short time. The stock surged by over 35% in the last two months and remained on top.
Daily Charts Shows Rising Parallel Channel
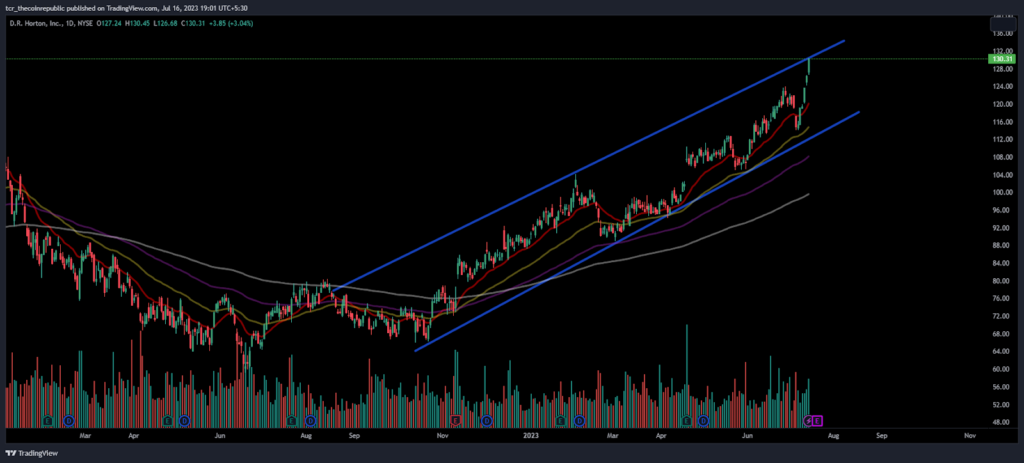
On the daily charts, DHI stock showed a massive incremental move and a vertical rally from the past months. The stock continues to make higher highs every day, putting the sellers in trouble who persisted in covering their positions.
As per the Fib extension, DHI stock is rising towards the 78.6% level near $140 for the following sessions.
Short Term Charts Show a Massive Breakout
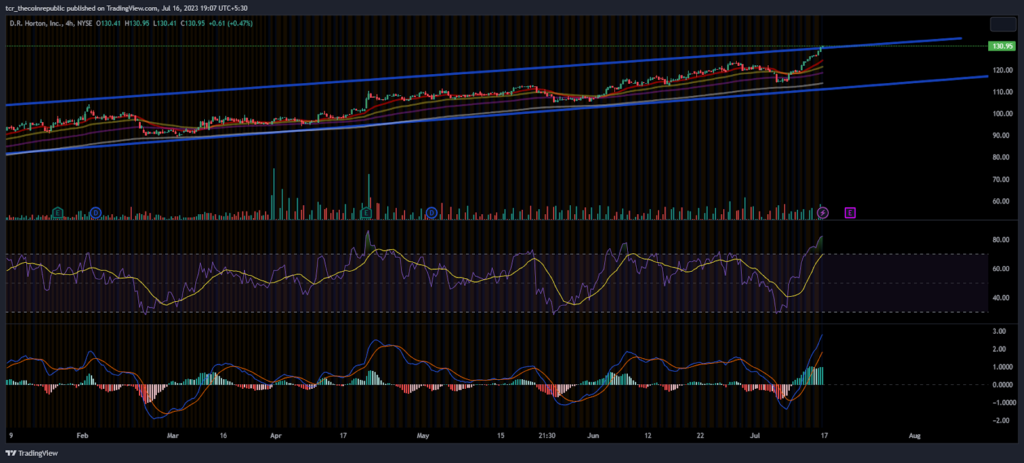
On the 4 hours chart, DHI stock price is trading near the channel’s upper trendline near $130, indicating an upcoming range breakout. Moreover, the previous candle closed above the upper bollinger band, indicating a breakout.
The RSI curve sharply rose above the overbought zone near 80, indicating that a massive buying spree occurred in the last few sessions. Moreover, the positive crossover is also noted, suggesting the stock’s bullishness.
The MACD indicator shows that incrementing green candles formed on the histogram which suggests the buyers are ramping up activities.
Conclusion:
D.R. Horton (DHI) stock breaking the walls with a massive volume spike showing that buyers are gaining momentum and are unwilling to pause. Moreover, a further rise toward $150 could be seen in the following sessions.
Technical Levels:
Support Levels: $120
Resistance Levels:$138 and $150
Disclaimer
The views and opinions stated by the author, or any people named in this article, are for informational purposes only and do not establish financial, investment, or other advice. Investing in or trading crypto assets comes with a risk of financial loss.
Mr. Pratik chadhokar is an Indian Forex, Cryptocurrencies and Financial Market Advisor and analyst with a background in IT and Financial market Strategist. He specialises in market strategies and technical analysis and has spent over a year as a financial markets contributor and observer. He possesses strong technical analytical skills and is well known for his entertaining and informative analysis of the Financial markets.


