
 Home
Home News
News
- 1 APT price shows a symmetrical triangle pattern on the charts.
- 2 The daily RSI surpasses the neutral zone to 55.
APT price is near to breaking out of the consolidation phase and forming a symmetrical triangle pattern to move out. Moreover, the price action showed lower lows sequences from the past months.
APT Token dropped by more than 50% in the last three months. This shows seller attainability toward the token who persisted in making short positions and enjoyed the downtrend.

However, the token refused to fall near the support mark of $5.40 and rebounded from it. The token now intends for a reversal, and buyers started to accumulate to retest the round mark of $10.00.
The chart structure shows the token trajectory below $8.00 is under the sellers’ hands, and further retesting can be a selling opportunity for the sellers, as multiple barriers exist near it. On the other hand, if it surpasses, fresh reversal momentum arises, and the price switches the gains to $10.00.
The price action showed that the APT token in a corrective phase from the past months couldn’t hold the strength, and fell below the key moving averages. APT price is now facing a barrier of 20-day EMA and trying to grab $8.00.
At the time of writing, APT price is trading at $7.62 with an intraday gain of 1.08% showing reversal indications on the chart. Moreover, the intraday trading volume increased by 8.14% to $159.15 Million, and the pair of APT/BTC is at 0.000252 BTC. The market cap is $993.47 Million.
Daily Charts Shows APT Struggling Below $8.00

On the daily charts, the APT token has struggled below $8.000 and tried to surpass it. Moreover, the chart indicates seller dominance, while buyers are willing to regain their strength and attain momentum to escape the upper trendline of $7.70. Similarly, sellers tried to break the lower trendline of $7.10 and tried for further breakdown in the token price.
As per the Fib levels, the APT price trades below 23.6%. Furthermore, the bollinger band is squeezing and suggesting a further decisive move.
What Do the Technical Indicators Say?
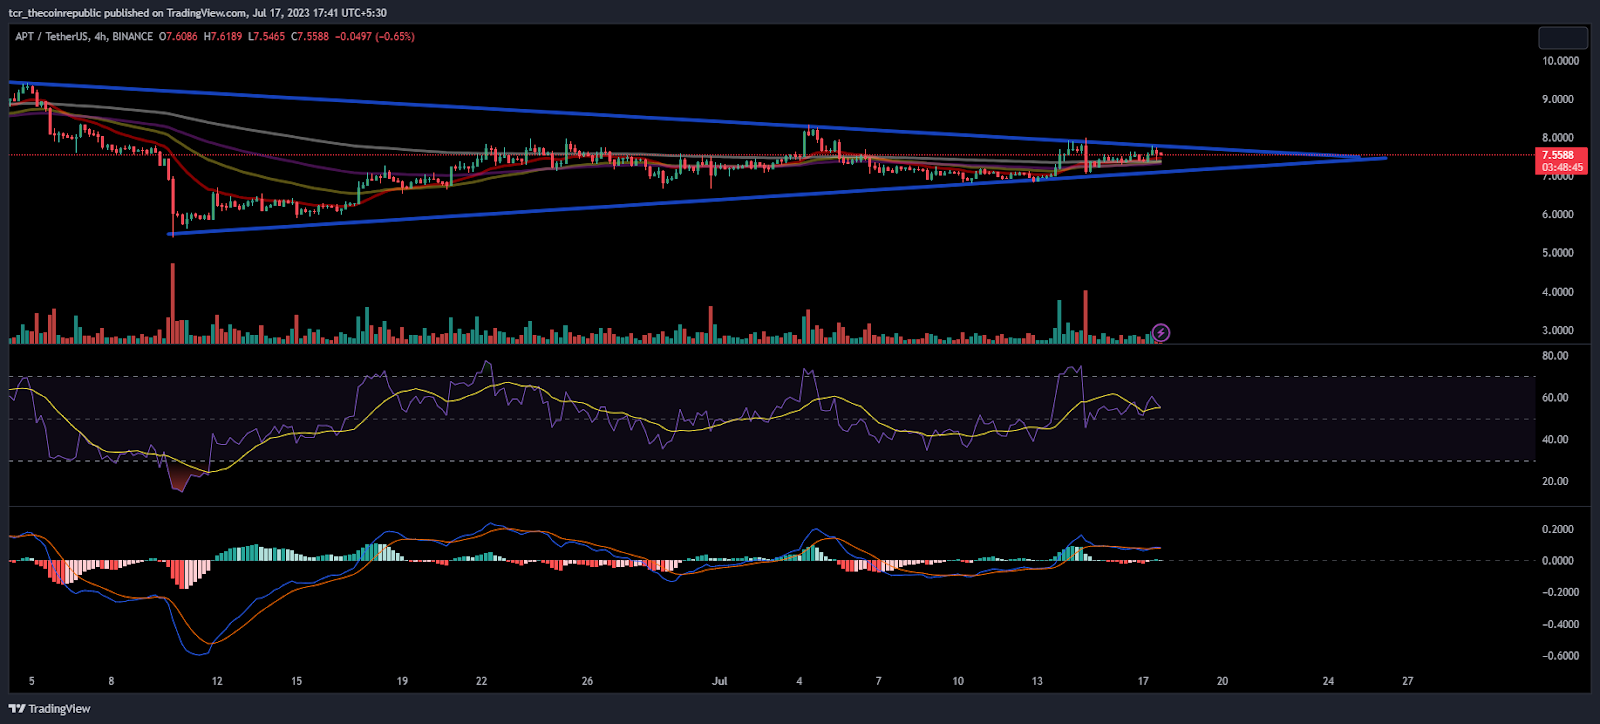
On the 4-hour charts, the APT token is close to registering a breakout as the price has entered into the neutral range from the seller region.
The RSI curve is near the neutrality of 55, forming a negative divergence on the charts.
The MACD indicator showed a convergence of moving averages and a neutral outlook on the charts.
Conclusion
Aptos token showed a neutral chart structure but is preparing for a decisive move in the following sessions. Moreover, the price is close to the trendline, which leads to further actions in the charts if it breaks.
Technical Levels:
Support Levels: $6.800
Resistance Levels:$8.000 and $8.6000
Disclaimer
The views and opinions stated by the author, or any people named in this article, are for informational purposes only and do not establish financial, investment, or other advice. Investing in or trading crypto assets comes with a risk of financial loss.

With a background in journalism, Ritika Sharma has worked with many reputed media firms focusing on general news such as politics and crime. She joined The Coin Republic as a reporter for crypto, and found a great passion for cryptocurrency, Web3, NFTs and other digital assets. She spends a lot of time researching and delving deeper into these concepts around the clock, and is a strong advocate for women in STEM.


