


Chia price prediction indicates that the XCH token is facing critical resistance from 100 EMA. The price is moving within a consolidation range at present. The XCH price has recently attempted to make a retest from its significant resistance level without success. The majority of indicators are pointing towards the bearish direction which implies the Chia price may see a substantial surge in selling pressure once it breaks below the range.
Chia network was formed in 2017 to develop an improved blockchain and smart transaction platform. Chia is using the first Nakamoto platform since Bitcoin called proof of stake and time. It was created by Bram Cohen, a network protocol engineer and inventor of BitTorrent. Chialisp is Chia’s new transaction programming language that is powerful, easy to audit, and secure.
The present value of Chia is $34.00. It has a market capitalization of around $267.04 Million which fell over the last few weeks.
ChiaPrice Prediction: Technical Analysis on Daily Chart
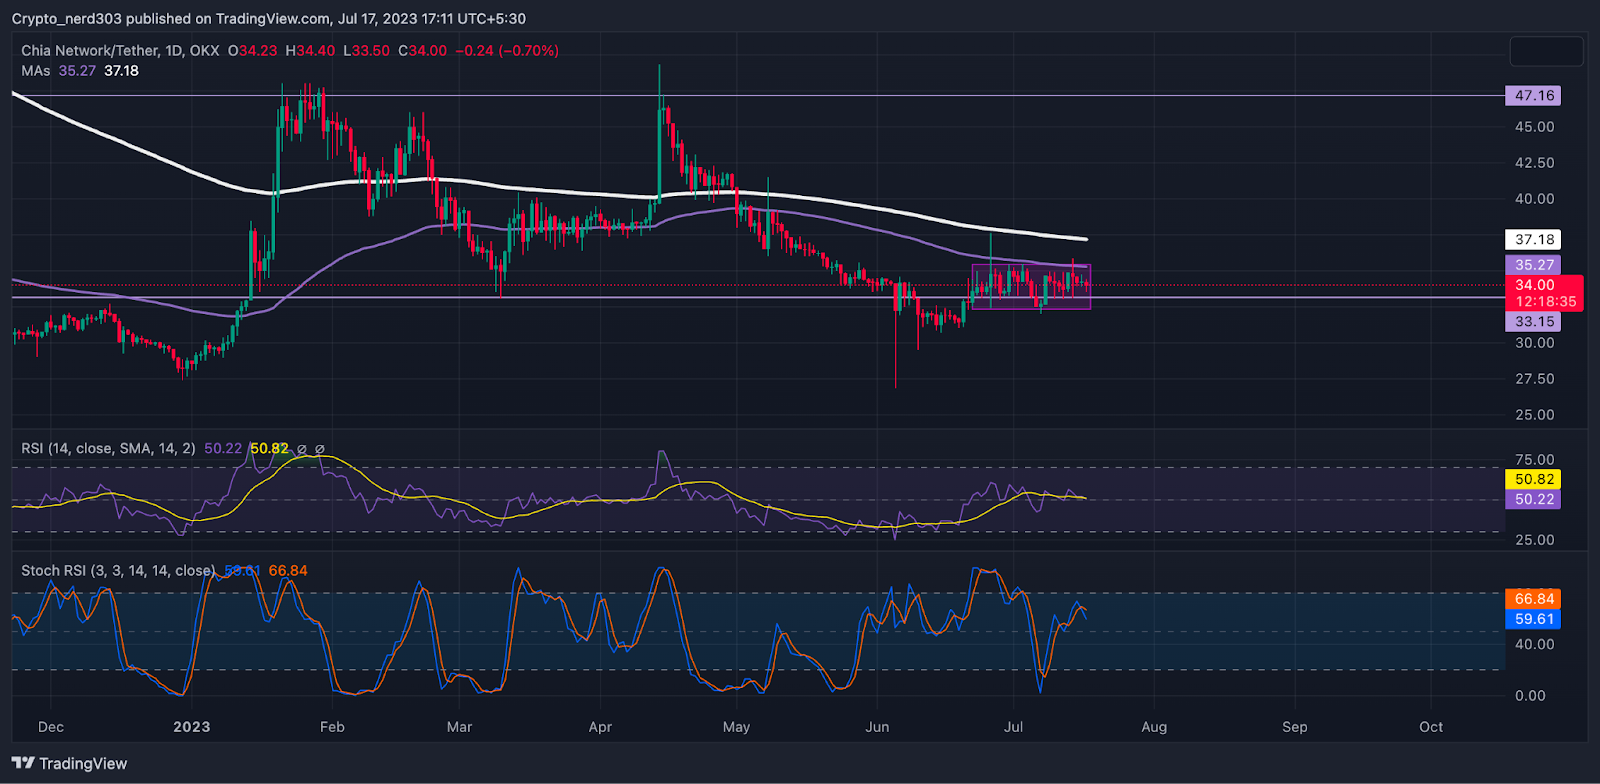
Chia price is making doji and spinning top candles near the supply zone after making a rally which is an indicator of exhaustion in buying pressure. If XCH price initiates a breakout in the seller’s favor, it can see a decline of 13 to 20% within the next few weeks. The Chia token is presently in a deaccumulation phase, according to the candlestick patterns.
Technical Indicators (Volume, RSI, and Stochastic)
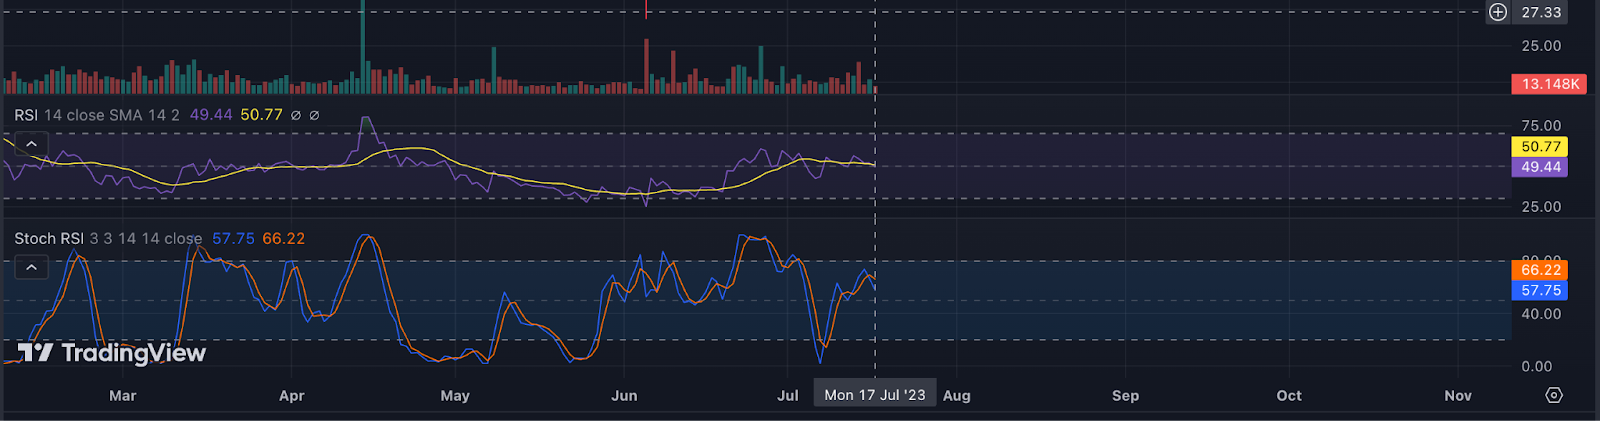
The red volume candles are seeing an increase in the past few weeks. The increasing volume of candles suggests that selling pressure is presently increasing in the overall market.
The relative strength index (RSI) line is presently consolidating near the median line on the one-day chart. The present value of the RSI is 49.44 points and the value of the 14-day SMA is 50.77 points. The RSI line is likely to receive a correction.
At present, the stochastic RSI line indicates it is advancing towards the demand zone and may soon cross below the median line. The value of the stochastic RSI is 57.75 points. The %K line is intercepting the %D line.
Conclusion
According to the analysis, XCH token is trying to breach its major barrier level near the 200 EMA. An increase in selling pressure was observed in the volume which indicates that there is a surge in trading activity.
Technical Levels:
Support -$28.00
Resistance – $36.00
Disclaimer
The views and opinions stated by the author, or any people named in this article, are for informational purposes only, and they do not establish financial, investment, or other advice. Investing in or trading crypto assets comes with a risk of financial loss.


