
 Home
Home News
News
- 1 The Adobe Inc. (ADBE) stock price is trading at $532.23 currently with a market capitalization of $242.59 Billion.
- 2 ADBE stock gave more than 38.66% return to investors in a year.
Adobe Inc stock provides designers and businesses with millions of photos, videos, illustrations, vector graphics, 3D assets, and templates that are high-quality and royalty-free for their creative projects. Adobe stock is supported by a community of professional artists who add new and varied content every day.
The stock has a market cap of $300.95 Billion, a P/E ratio of 54.97, a dividend yield of 0%, and a 52-week range of $420.78 – $674.88. On July 19, 2023, it closed at $637.64, rising 0.34% from the day before.
Adobe’s net income was $1.14 Billion. Adobe also earned $2.42 per share on a GAAP basis and $3.40 per share on a non-GAAP basis. Adobe earn revenue of $4.43 Billion in its third quarter of fiscal year 2022 which grew 13% year-over-year.
Weekly Analysis of ADBE Stock
The stock price of Adobe Inc. has risen above the 50 and 200-day moving averages in the weekly chart, indicating a strong bullish trend. The market is optimistic about ADBE’s performance. Moreover, the weekly RSI and MACD are also in favor of the bulls.
ADBE Stock Price Technical Analysis
The market is showing strong buying interest in Adobe Inc. (ADBE) as its stock price has gone above the 200-day and 50-day moving averages. The stock price could continue to climb higher and start an uptrend if the buyers keep pushing. Furthermore, the bullish cross on the daily chart supports the bullish outlook.
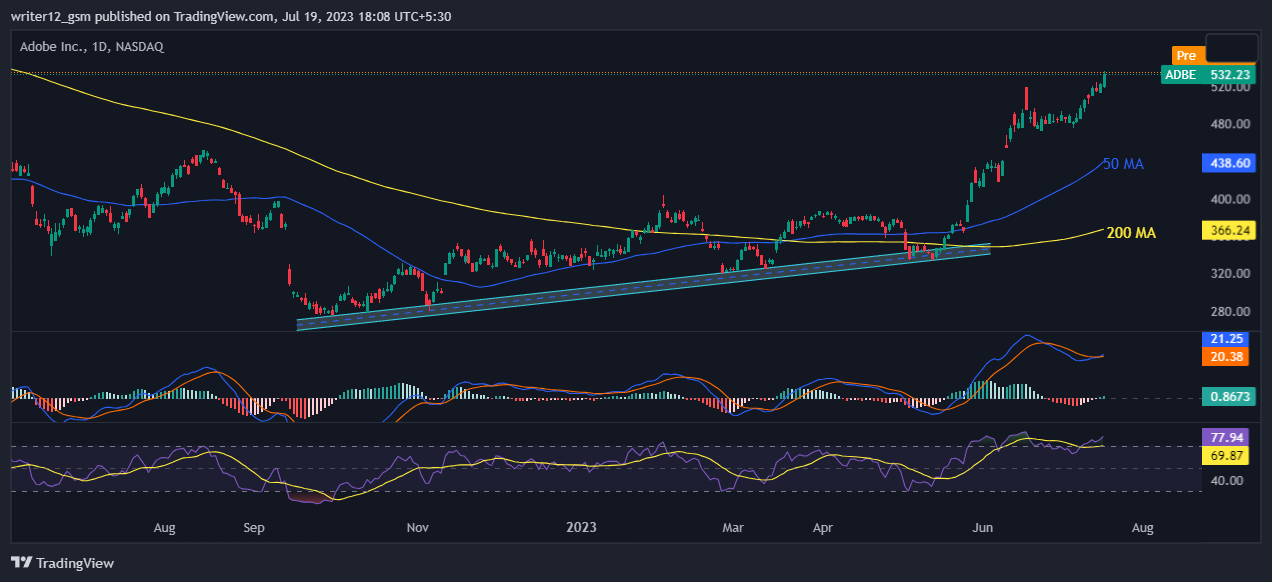
The RSI has been heading toward an overbought area. The RSI line is around 77.94. The 14 SMA line has a value of 69.87 points which implies that Adobe Inc.’s price is in the bullish area and is extremely positive.
Currently, MACD is giving bullish signals. The MACD line at 21.25 and the signal line at 20.38 is above the zero line, indicating that the MACD is in positive territory and is giving positive signals as of now.
The Supertrend indicator shows a green signal, reinforcing the bullish sentiment. This suggests that Adobe’s stock is likely to continue its upward trend, offering potential opportunities for traders and investors.
Conclusion
Adobe stock has been doing well, reaching new highs and growing its earnings. Abode is hitting higher highs and surpassing the 50- and 200-day moving averages on the daily and weekly time frames. The indicators, RSI, MACD, and supertrend are all positive, signaling a strong uptrend. The company is also buying new companies and making new products. Investors should be careful and do their homework before buying Adobe stock.
Technical Levels:
- Support – The current support level is $474.00.
- Resistance –The current resistance level is $555.00.
Disclaimer
The ADBE stock price prediction given in this article is for informational and educational use only. Do not use this information as financial, investment, or as trading advice. Investing and trading in stock is a risky task. Please consider your circumstances and risk profile before making any investment decisions.

Adarsh Singh is a true connoisseur of Defi and Blockchain technologies, who left his job at a “Big 4” multinational finance firm to pursue crypto and NFT trading full-time. He has a strong background in finance, with MBA from a prestigious B-school. He delves deep into these innovative fields, unraveling their intricacies. Uncovering hidden gems, be it coins, tokens or NFTs, is his expertise. NFTs drive deep interest for him, and his creative analysis of NFTs opens up engaging narratives. He strives to bring decentralized digital assets accessible to the masses.


