
 Home
Home News
News
- 1 Kusama is trading at $24.02 while seeing a rise of 41.14% in the 24-hour trading volume (press time).
- 2 Kusama price recorded a rise of 0.16% in the last 7 days.
Kusama price prediction forecasts that KSM token may make a breakout within the next few weeks. The price is presently moving at the edge of a descending triangle. A descending triangle indicates the buildup of buying and selling pressure which often results in a breakout. Investors may keep a keen watch over the token to gain the advantage of the presented opportunity.
The descending triangle pattern often gives advantages and lucrative prospects as it often offers good target points if the breakout is made in favor. The general direction of breakout for descending triangles is said to be bullish though the buyers may practice caution and wait for a retest before entering the market. The Kusama price is yet to break the triangle.
Decrease In LunarCrush Levels: Kusama

Despite the drop in the majority of parameters shown on the LunarCrush platform, the 24-hour volume of Kusama token observed a spike. It is recording a surge of 41.14%.
The total bullish sentiment metric receded by 80.52%. A sharp fall of 66.42% was also observed in the total social engagement level which suggests that the potential buyers in the community are showing apprehension regarding Kusama crypto.
Significant Hike In Greed Sentiment Of Investors
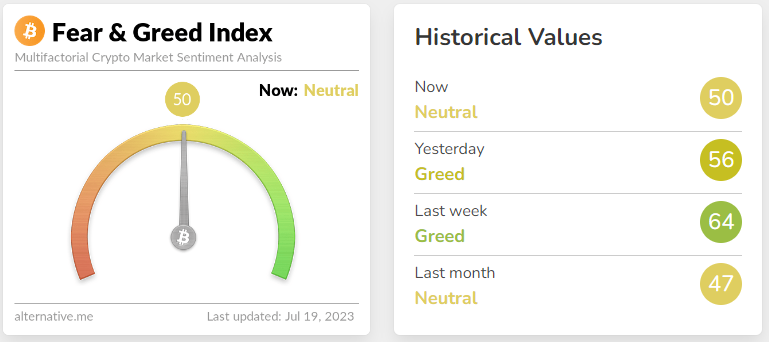
Investor sentiments concerning the overall cryptocurrency market are neutral. The sentiment index metric declined slightly within a brief period of time by 6 points. The current value of the sentiment index is 50 points as per the Alternative(dot)me platform.
Kusama Price Prediction: Technical Analysis On Daily Timeframe
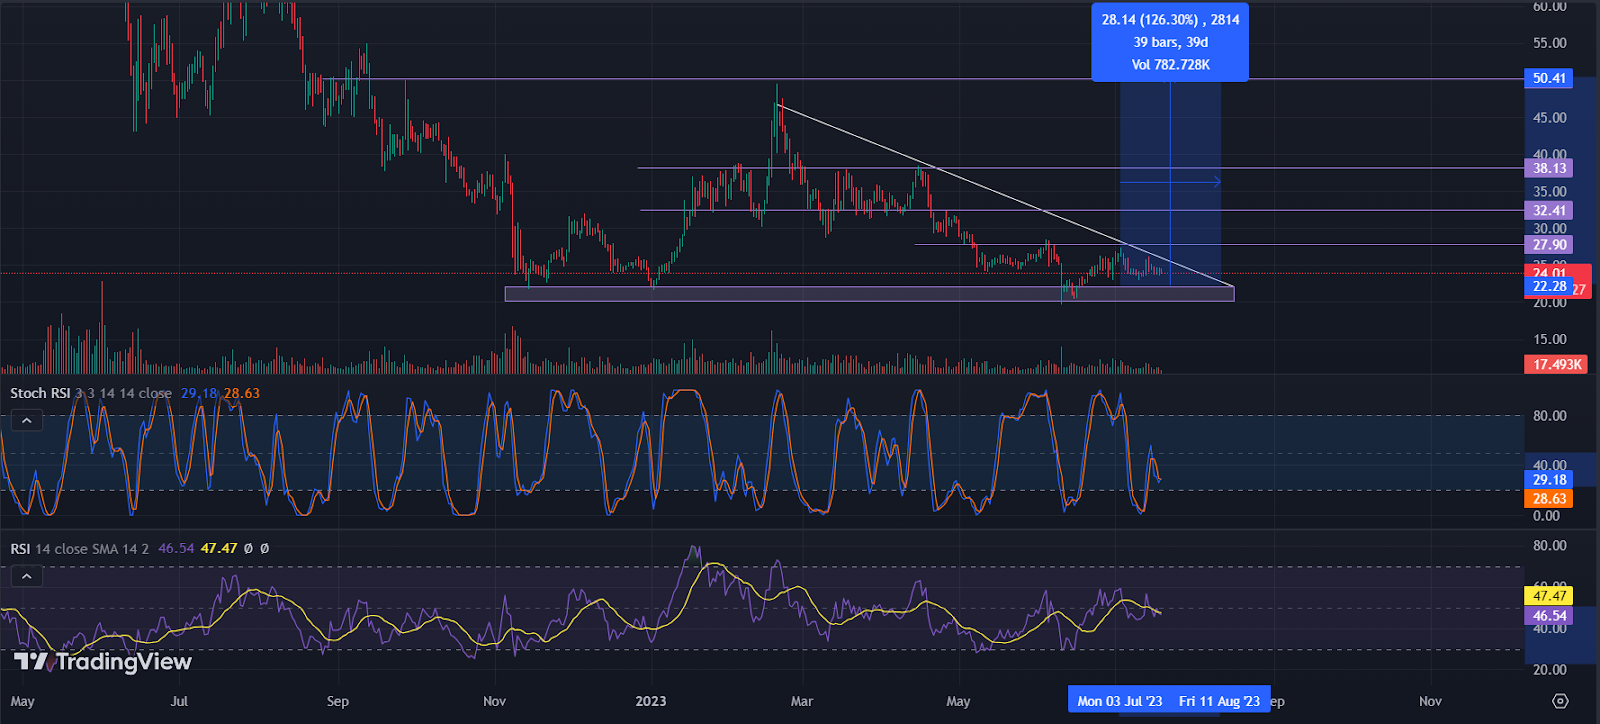
If the KSM token makes moves in a favorable direction for the bulls, the investors can attain a decent target. The marked target points are – $28, $32, $40, and $50 which is 126% above the current price.
The relative strength index (RSI) line is moving near the neutral zone. The present value of the RSI is 46.54 points and the value of the 14-day SMA is 47.47 points.
At present, the stochastic RSI is advancing towards the demand zone and the value of the stochastic RSI is 29.18 points. The %K and %D are giving a negative cross near the demand zone.
Conclusion
As per the analysis, the price is presently moving at the edge of the descending triangle. A descending triangle indicates the buildup of buying and selling pressure which often results in a breakout. The 24-hour trading volume saw a spike in value which signifies that the Kusama token is being actively exchanged between buyers and sellers.
Technical Levels:
Support –$20.00
Resistance – $28, $32, $40, and $50
Disclaimer:
The views and opinions stated by the author, or any people named in this article, are for informational purposes only, and they do not establish financial, investment, or other advice. Investing in or trading crypto assets comes with a risk of financial loss.

With a background in journalism, Ritika Sharma has worked with many reputed media firms focusing on general news such as politics and crime. She joined The Coin Republic as a reporter for crypto, and found a great passion for cryptocurrency, Web3, NFTs and other digital assets. She spends a lot of time researching and delving deeper into these concepts around the clock, and is a strong advocate for women in STEM.


