
 Home
Home News
News
- 1 The price of Bank of America (BAC) is trading at $31.53. However, the stock’s price inclined by 2.70% in the last 24 hours (press time).
- 2 BAC price observed an increase of 6.85% in the last 7 days.
- 3 The market capitalization of Bank of America is $250.776 Billion.
Bank of America (NYSE: BAC) delivered impressive financial results for the second quarter of 2023, surpassing analysts’ expectations on both earnings and revenue. The company’s revenue, net of interest expense, increased 11% year-over-year to $25.2 billion, and its net income rose 19% year-over-year to $7.4 billion, or $0.88 per share.
The company’s main Wall Street businesses did well, with fixed-income and equity trading revenue growing 18% year-over-year to $2.8 billion and investment-banking revenue improving almost 6% year-over-year to $1.6 billion. The only minor shortfall was in net interest income, which advanced 14% year-over-year to $14.2 billion, slightly lower than the expected $14.3 billion.
Bank of America Price Technical Analysis
Bank of America’s price has been heading towards 200 MA, two strong candles that show the influence of buyers in the market. If buyers continue to elevate the market, BAC could start an uptrend.
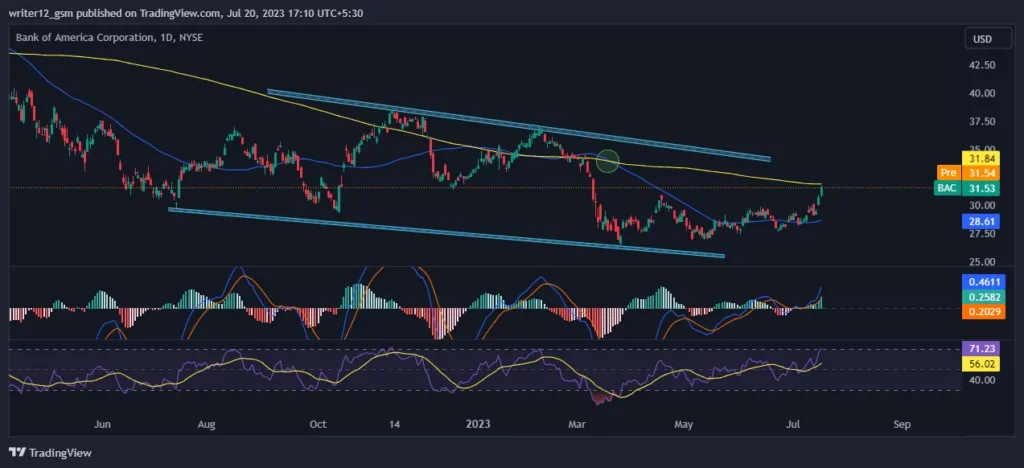
The RSI line is shifting toward the overbought area. The RSI line is at 71.23. The 14 SMA has a value of 56.02 points. However, the BAC price could rise, mainly if it breaks out of this channel pattern.
Currently, MACD is showing bullish signs. The MACD line at 0.4611 and the signal line at 0.2029 are above the zero line, meaning that the MACD is in positive territory and is giving bullish signs.
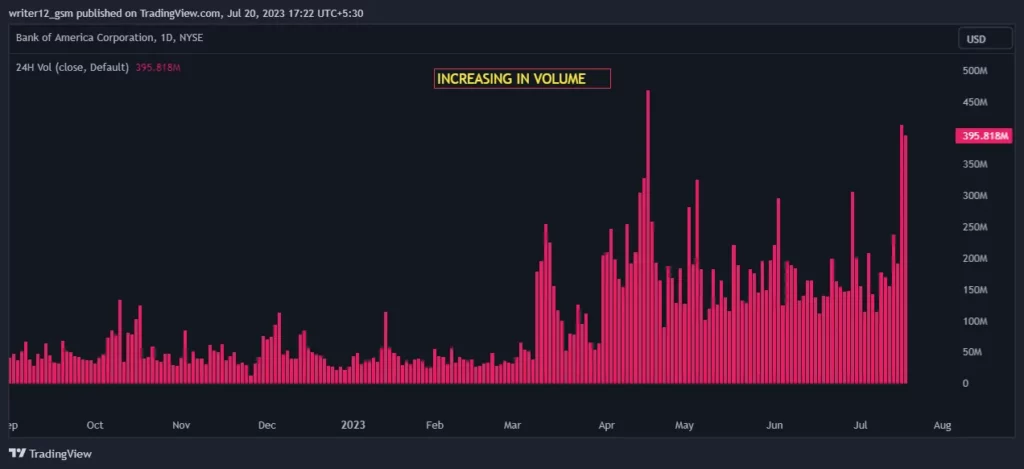
Volume Analysis:
Bank of America’s trading volume for the last 3 months is $46.77M, and we see a surge in volume in the last 10 days it has increased by 52.17 Million.
Technical Levels:
- Support – The current support level is $29.88.
- Resistance –The current resistance level is $32.68.
Conclusion
According to the latest data and evaluation, buyers have the upper hand in the market. This could lead to a bullish trend for BAC if they keep pushing the market higher. But BAC faces two challenges: a trendline and the 200-day EMA. The price action indicates that the investors must wait for a better opportunity for the next move. BAC’s price is currently in a neutral zone. In addition, indicators such as the EMA, RSI, and MACD show positive signs for Bank of America stock. The current situation requires traders and investors to be patient and watch for a clear breakout or breakdown of the range before making any moves in the future.
Disclaimer
The analysis given in this article is for informational and educational use only. Do not use this information as financial, investment, or trading advice. Investing and trading in stock is a risky task. Please consider your circumstances and risk profile before making any investment decisions.

Nancy J. Allen is a crypto enthusiast, with a major in macroeconomics and minor in business statistics. She believes that cryptocurrencies inspire people to be their own banks, and step aside from traditional monetary exchange systems. She is also intrigued by blockchain technology and its functioning. She frequently researches, and posts content on the top altcoins, their theoretical working principles and technical price predictions.


