
 Home
Home News
News
- 1 International Business Machines stock price closed at $138.38 with a gain of 2.14% during the last intraday session.
- 2 IBM stock price trades above the 20,50,100 and 200-day EMAs.
- 3 The year-to-date return is -1.93% while the three-month return is 9.83%.
IBM stock price started its bullish journey after the formation of support at $128.80 and rallied till the middle of June 2023. The stock price was melting since the start of 2023 after it faced rejection from $146.50. The bullish rally caused a rise of roughly 15.44% in the stock price and led to the formation of a June high at $139.47.
The price heavily rejected the high and entered into a corrective phase. The retracement caused a decline and the price fell below $130. IBM stock price formed support at $129.30 and regained bullish momentum to retest the resistance of $139.47. The last candle did shatter the resistance but could not sustain above it.
The stock price faced strong rejection above $140 and retraced back below $139.40. Last candle has left a long upper wick indicating bearish pressure over the price. If the next candle can break the high of the last candle, there is a possibility for the price to head toward the next resistance level of $142 as well as $146.50.

On the other hand, if the next candle breaks the low of the last candle, the price might melt toward $131.70. Even after the revenue missed by $100.625 million, the stock price popped up. The consensus estimated the earning per share to be $2.01 while the tech giant reported $2.18, a surprise of 0.167(8.27%).
Why Did IBM Stock Price Rise Even After Missing Revenue Estimates?
Wall Street was not worried about the revenue miss. Bank of America, BMO Capital, and Stifel hiked the price target after the earning results. Although the tech giant’s sales declined 0.4% YOY due to currency exchange rates, in “constant currency”, it record a revenue growth of 0.4% YOY making this the quarter 2 of growth.
Software and consulting business divisions also recorded revenue growth despite currency headwinds with only the infrastructure division witnessing lower sales. Gross profit margin also surged by 160 basis points at 54.9%, helping GAAP earnings to climb 13%.
Will IBM Stock Price Reach $150 In July?
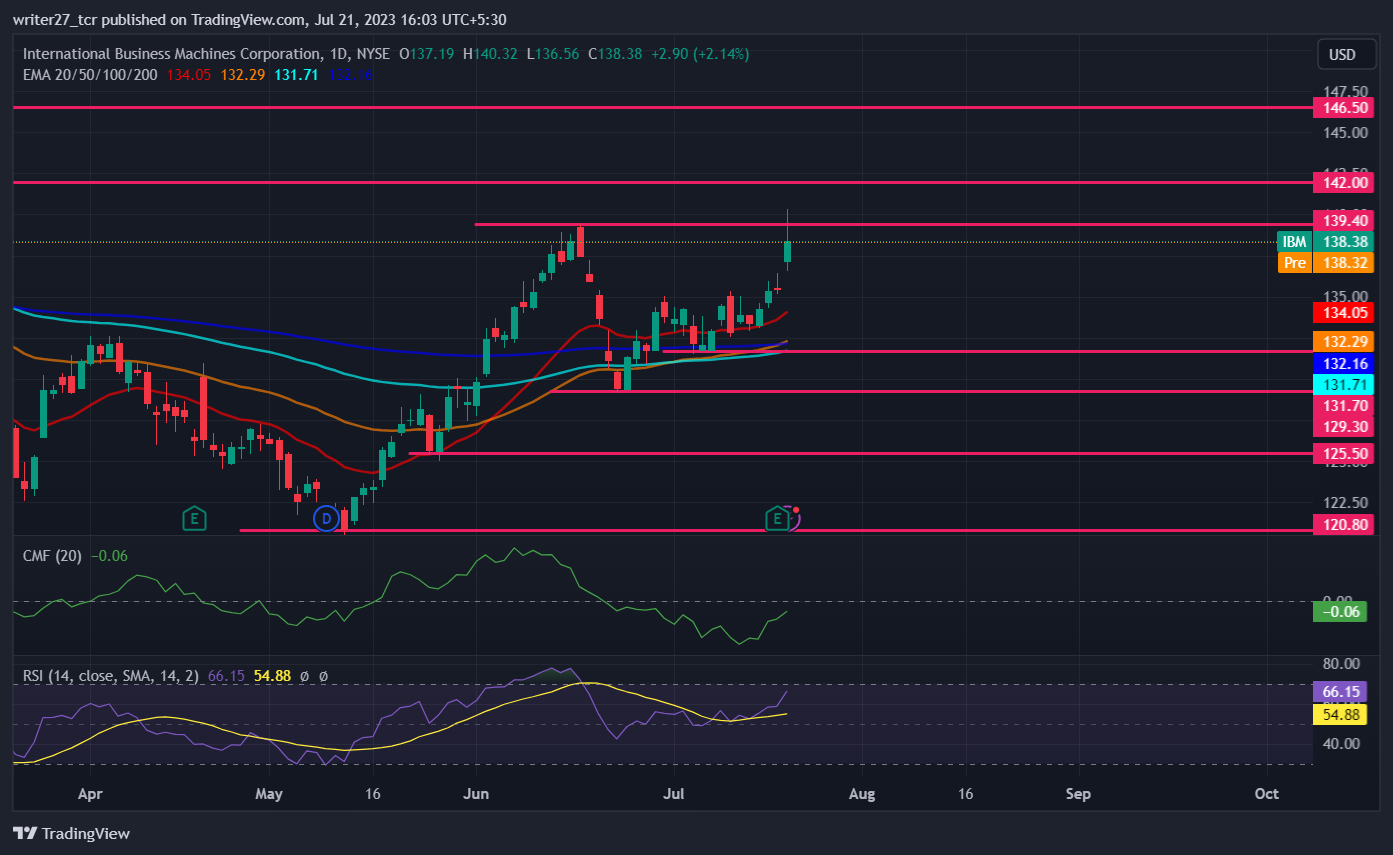
The stock price of IBM trades above 20,50,100 and 200-day EMAs, indicating bullish momentum. However, Chaikin Money Flow (CMF) score is -0.06, suggesting weakness in the market and CMF has not crossed the above 0 mark. RSI stands at 66.15, implying the price possesses bullish momentum and nearing the overbought zone.
Conclusion
Technical parameters favouring the bulls but traders should wait for the price to break and close above the resistance of $139.40 before looking for bids. The management also stated that the free cash flow could approach $10.5 billion, an improvement of 10% YOY.
Technical levels
Major support: $129.50 and $125.50
Major resistance: $142 and $146.50
Disclaimer
The views and opinions stated by the author, or any people named in this article, are for informational purposes only. They do not establish financial, investment, or other advice. Investing in or trading crypto assets comes with a risk of financial loss.
Steve Anderson is an Australian crypto enthusiast. He is a specialist in management and trading for over 5 years. Steve has worked as a crypto trader, he loves learning about decentralisation, understanding the true potential of the blockchain.


