
 Home
Home News
News
- 1 Nike, Inc. is currently trading at $109.06, with a 1,42% drop in the past 24 hours. However, the share price rose by 1.04% in the last 7 days.
- 2 The stock faces a triple threat of formidable obstacles: the 50-day moving average, the 200-day moving average, and the relentless trendline resistance.
Nike, Inc. is a U.S.-based company that makes and sells athletic shoes, clothing, and accessories. It is headquartered near Beaverton, Oregon. Its common stock trades under the symbol NKE.
NKE has a market value of $167.635 Billion. It has been growing its sales and profits consistently. In 2022, it earned $51.22 Billion in revenue and $5,07 million in net income. Its net profit margin was 9.90% for 2022. The company owes $12.14 Billion in debt, but it also has $7.44 Million in cash and equivalents.
However, the stock price does not reflect the strong technicals as of now. It is trading below the 200-day and 50-day moving averages, indicating bearishness.
Nike, Inc. Stock Price Technical Analysis
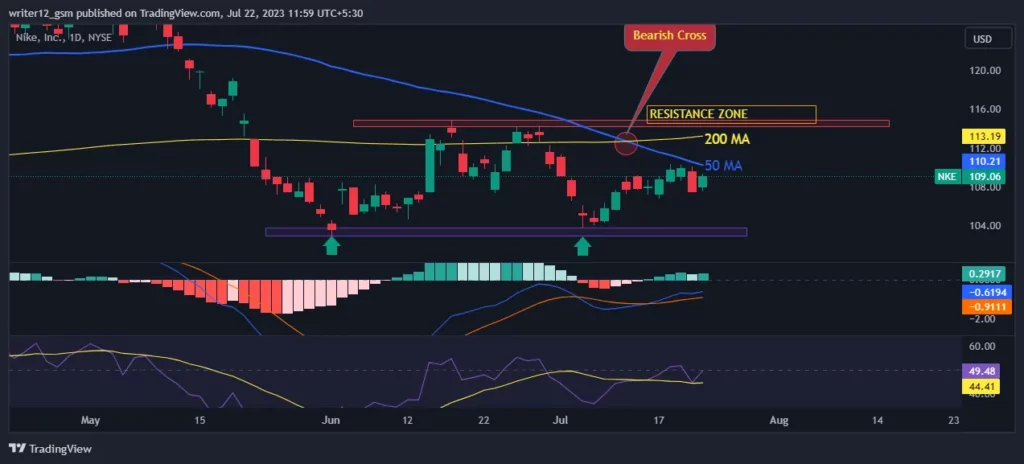
Nike, Inc. stock price is displaying strong bearish momentum as its price has been trading below the 50-day and 200-day moving averages. The stock is confronted by three daunting challenges: the 50-day and 200-day moving averages and the unyielding trendline resistance. Moreover, if the price breaks these hurdles, then a new trend could start.
The MACD line has crossed above the signal line, which is a positive sign. Currently, the MACD is at -0.6194 points, and the signal line is at -0.9111 points, and both are below the zero line in the negative area.
The RSI is close to the median line, reflecting a neutral trend. Currently, the RSI is at 49.48 points, and the 14-day SMA line is at 44.41 points, and both are close to the median line and give a neutral outlook.
The super trend line is above the price, showing a red signal and suggesting a negative trend.
Volume Analysis
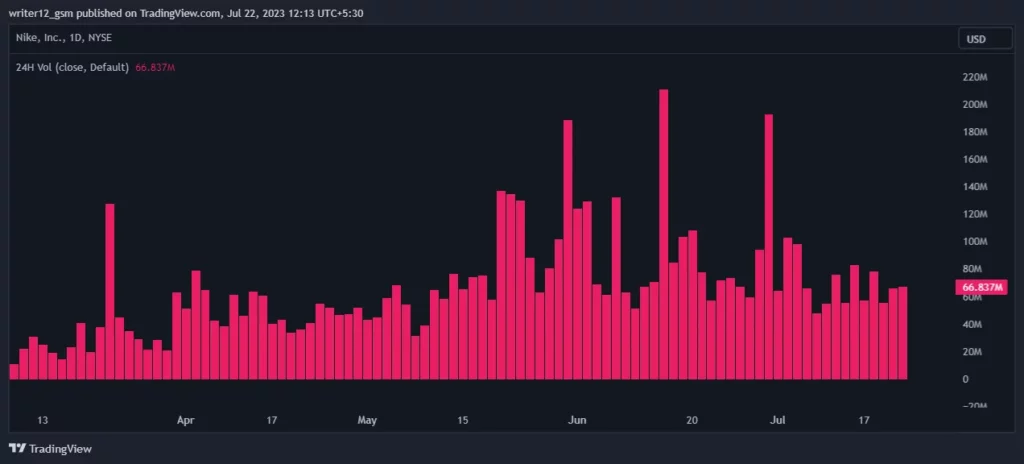
Nike, Inc.’s average trading volume for the last 24 hours is 6.632 Million. The average volume for the last 10 days is 6.328 Million.
Summary
The chart of Nike, Inc.’s stock shows a lack of clear direction at the moment. The technical indicators MACD, RSI, and super trend are giving mixed signals, suggesting that the NKE stock is in a sideways trend. The price is trading between two key levels: the support level at $103.00 and the resistance level at $114.30. The next move will depend on whether the price can break above or below these levels and establish a new trend.
Technical Levels
- Support Level – The current support level is $103.00.
- Resistance Level – The current resistance level is $114.38.
Disclaimer
This article is only for information and education purposes. Do not use this information as financial or trading advice. Trading and investing have financial risks. Before making any investment or trading decision, please think about your risk tolerance and situation.

Nancy J. Allen is a crypto enthusiast, with a major in macroeconomics and minor in business statistics. She believes that cryptocurrencies inspire people to be their own banks, and step aside from traditional monetary exchange systems. She is also intrigued by blockchain technology and its functioning. She frequently researches, and posts content on the top altcoins, their theoretical working principles and technical price predictions.


