
 Home
Home News
News
- 1 The price of XDC is trading near $0.050 with a rise of around 280% in the 24-hour trading volume.
- 2 The XDC price is up by 57% within the last 7 days.
Xinfin price prediction shows that buyers hold buoyant regards about XDC price. It recently gave an extremely bullish move exceeding the expectations and target. The price is moving on an uptrend above the daily chart. The price is seeing a dramatic surge of 80% within the last 12 days, a relatively short period. There is an increase in exuberant sentiments among the buyers though the sellers might attempt to take the control back.
Presently, the price is moving in the greed zone of the market structure. It made its recent high near the end of July. According to the price action, the market structure, the EMA levels, and oscillators, the bears may try entering the price action shortly. Investors might count on this edge to plan their next move.

In the previous analysis, it was estimated that after taking support from the trend line, the Xinfin price may break out, crossing above the crucial resistance levels. It was evaluated that Xinfin’s price can attain a 30% to 40% target despite the challenges presented by multiple EMAs though the price gained an extremely bullish momentum. The price shot up 80%, which is twice the expected target. The bulls have won this battle though the war is yet to be triumphed.
XDC, previously known as XinFin Network, is a hybrid blockchain platform that merges the transparency of public blockchains with the swiftness and security of private networks. The project planned to deliver streamlined financial services to its users. XinFin Network was launched in 2017 and is based in Singapore.
Xinfin Price Prediction: Technical Analysis on Daily Chart
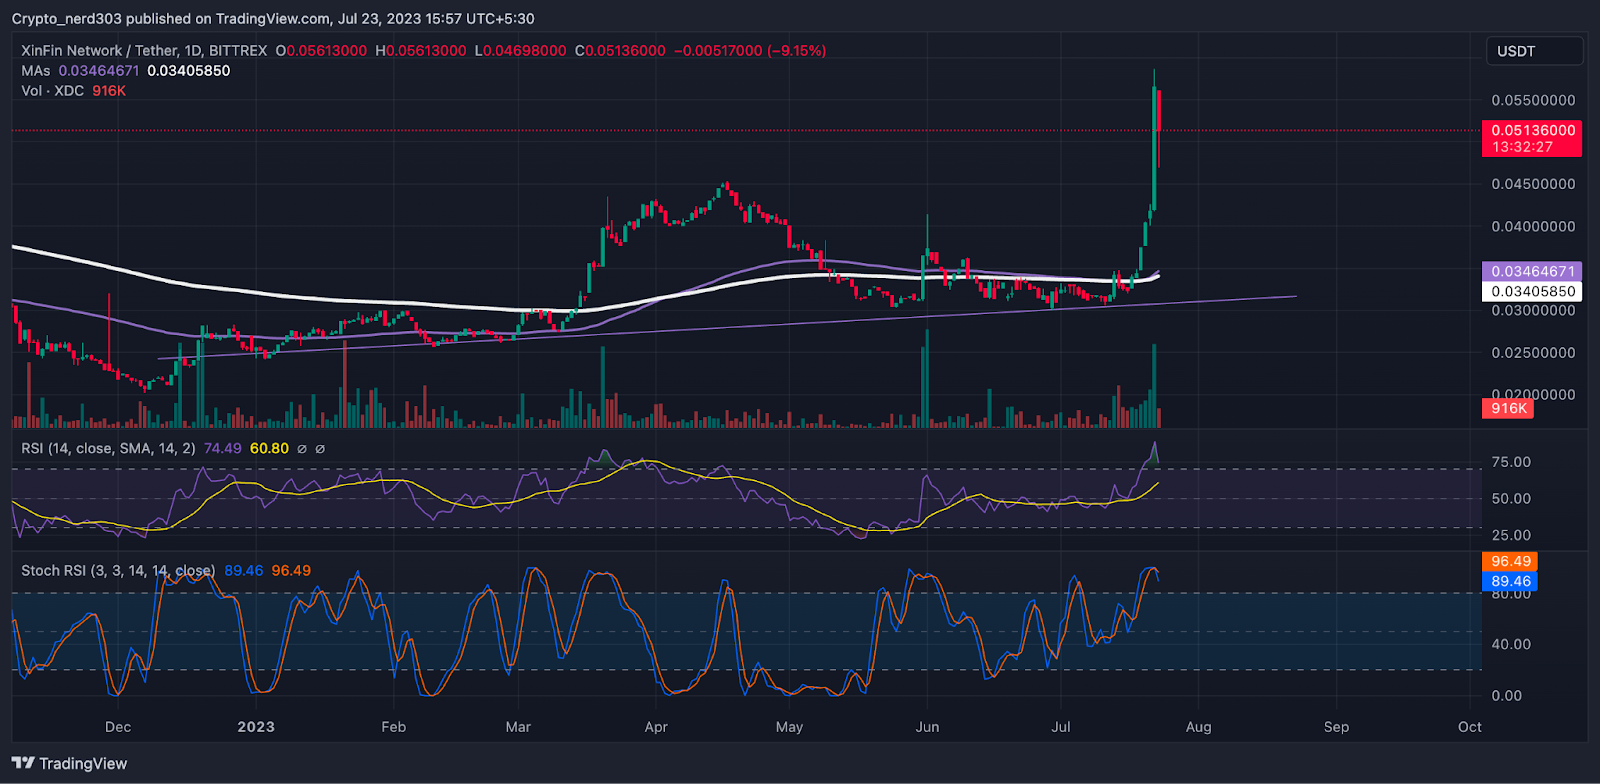
If the sellers succeed in taking control of the price action, Xinfin crypto may see a downturn shortly on the one-day chart. However, as there is no major resistance present, the price action is still bullish and the buyer’s optimism is not dampened yet despite the bearish candles.
The relative strength index (RSI) line is moving in the greed zone. The current RSI value of the XDC token is 73.52 points. The RSI line is presently taking support from the 14 SMA levels at around 63.72 points.
The stochastic RSI line is moving near the overbought line and might make a negative crossover. The present value of the stochastic RSI is 89.46 points, it is presently in the neutral zone.
Conclusion
According to the analysis, the XDC token is consolidating in the supply zone on the day chart above crucial EMA levels. If the sellers succeed in taking control of the price action, Xinfin crypto can lose 11 – 24% of its value shortly.
Technical Levels:
Support -$0.040
Resistance – $0.030
Disclaimer
The views and opinions stated by the author, or any people named in this article, are for informational purposes only, and they do not establish financial, investment, or other advice. Investing in or trading crypto assets comes with a risk of financial loss.
Steve Anderson is an Australian crypto enthusiast. He is a specialist in management and trading for over 5 years. Steve has worked as a crypto trader, he loves learning about decentralisation, understanding the true potential of the blockchain.


