
 Home
Home News
News

- 1 Quant Price Prediction is bullish till it holds $100 and suggests a rise in the long run.
- 2 QNT price trading below the 50-day and 200-day EMA showcase downtrend.
- 3 Quant crypto price struggles to defend $100.00 support.
Quant Price Prediction suggests a rise and significant increase in the value is expected in the long run. QNT Price consolidating near the demand zone, and buyers are trying to defend the $100.00 support.

Quant Price struggles to climb above the 50-day EMA to reverse the short-term trend in favor of bulls. However, the 200-day EMA is placed slightly higher denoting that the positional trend is down.

In the mid of June, Quant crypto price took support near $95.00 and showed a sharp rise of 14%. At the same time, the volume also increased which created a positive hope for the bullish trend reversal.
Sadly, QNT crypto faced a hurdle near $118.00 and prices failed to give the follow-up momentum. Later, prices faced minor profit booking and prices returned back to the demand zone.
The crypto leader BTC and Ethereum Prices performed well in the past few months despite Quant Price remaining calm.
Quant Price is trading at $103.00 with an intraday decline of -1.43%. The 24-hour volume to market cap is 1.23%. The QNT/BTC pair is trading at 0.003489 with an intraday rise of 0.11%.
The price chart of QNT/BTC is also in a downtrend, and sellers seem more active than the USDT pair.
Will Quant Price respect the demand zone?
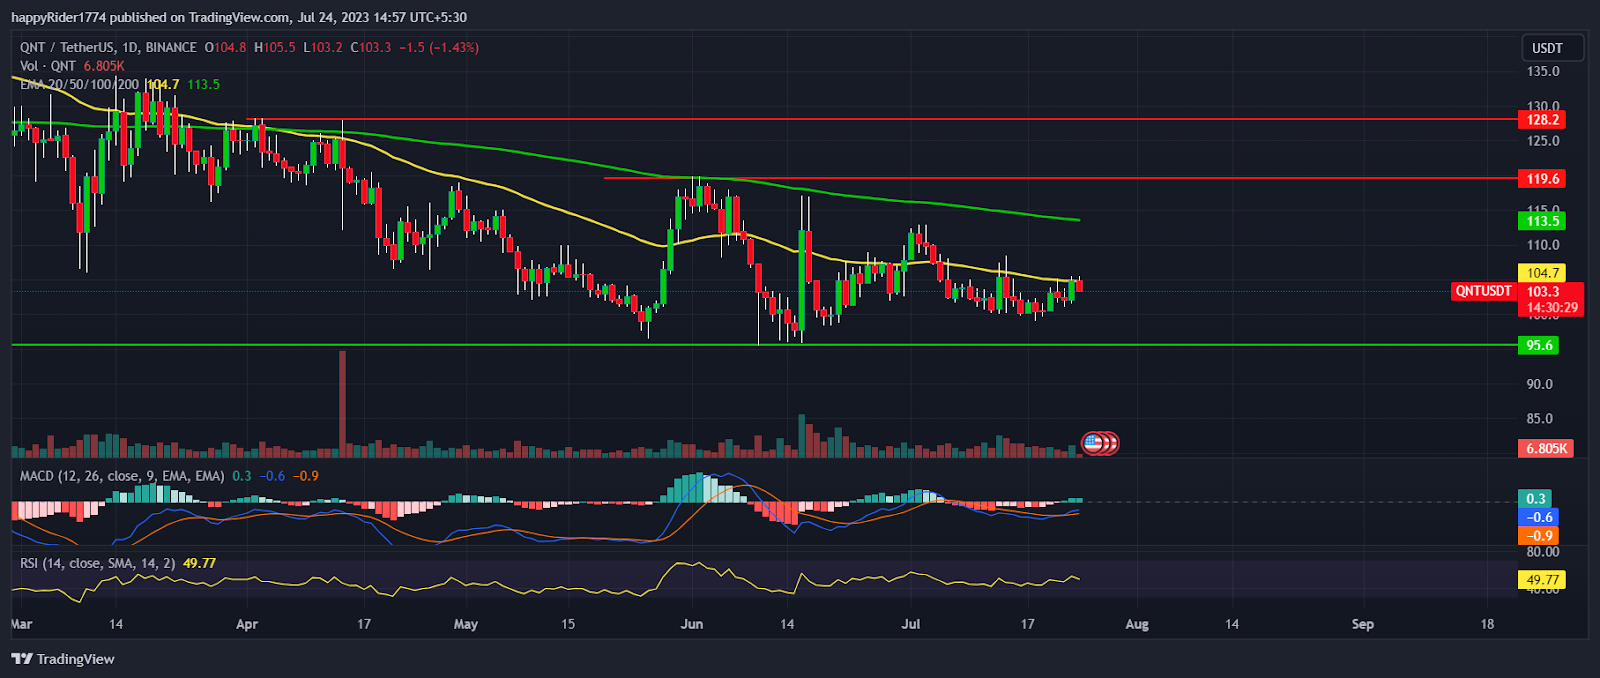
Quant Price Prediction showcases consolidation for a short-term period. It tried multiple times to break the $110.00 hurdle but got rejection indicating sellers are active on higher levels.
Till QNT Price sustains above $95.00 the possibility of taking a U-turn remains high. However, the price will gain momentum when buyers are able to break out of the 200-day EMA.
On the other hand, if the Quant Price drops below $95.00 then a 15% to 20% correction is possible. The technical analysis suggests QNT price is consolidating for the base formation and it is likely to respect the demand zone.
QNT Price Analysis on the weekly time frame
QNT Price is mildly bearish on a weekly time frame, forming a bearish candle. If the overall market recovers then it might positively impact the QNT prices.
The MACD curve displayed a positive crossover and the histogram bar is on the rise. It indicates short-term recovery is possible. The RSI at 48 denotes neutral territory and prices might consolidate for some more time.
Conclusion
Quant Price Prediction suggests a rise in the long run. However, the price will gain momentum when buyers succeed in breaking the 200-day EMA. The technical analysis suggests QNT crypto price is near the demand zone and the downside looks limited.
Technical levels
- Resistance levels: $120.00 and $128.00
- Support levels: $100.00 and $95.00
Disclaimer
The views and opinions stated by the author, or any people named in this article, are for informational purposes only. They do not establish financial, investment, or other advice. Investing in or trading crypto assets comes with a risk of financial loss.

Andrew is a blockchain developer who developed his interest in cryptocurrencies while pursuing his post-graduation major in blockchain development. He is a keen observer of details and shares his passion for writing, along with coding. His backend knowledge about blockchain helps him give a unique perspective to his writing skills, and a reliable craft at explaining the concepts such as blockchain programming, languages and token minting. He also frequently shares technical details and performance indicators of ICOs and IDOs.


