
 Home
Home News
News
- 1 SNDL stock price is trading at $1.39 with a -0.72% drop in the past 24 hours. However, the share price dropped by -6.08% in the last 7 days.
- 2 SNDL Inc’s average trading volume for the last 24 hours is $1.626 Million. The average volume for the last 10 days is $2.664 Million.
SNDL (NASDAQ: SNDL) Inc is a Canadian cannabis company offering medical and recreational products under the Sundial Cannabis, Top Leaf, Palmetto, and Grasslands brands. The company is based in Calgary, Alberta, and produces high-quality cannabis and cannabis derivatives.
SNDL Inc Reports Q1 Performance
The company reported its Q1 2023 net revenue of $202.5 Million, down from $240.4 Million in Q4 2022, but up from $17.6 Million in Q1 2022, a year-over-year growth of 1,050%.

The company posted a Q1 2023 net loss of $36.1 Million, which was lower than the Q4 2022 net loss of $161.6 Million, but slightly higher than the Q1 2022 net loss of $38.0 Million. The Q1 loss was affected by lower Liquor Retail sales due to seasonality, and $10 Million of impairments on inventory and assets. In Q1 2023, the company earned $32.5 Million in gross margin, an 856% increase year-over-year but a 25.5% decrease quarter-over-quarter
The partial quarter contribution of Valens in 2023 mitigated the decline in revenue from the Cannabis Operations segment. Liquor Retail: Q1 2023 net revenue was $115.9 Million. Cannabis Retail: Q1 2023 net revenue was $67.4 Million. Cannabis Operations: Q1 2023 net revenue was $19.1 Million.
SNDL Inc Stock Price Technical Analysis
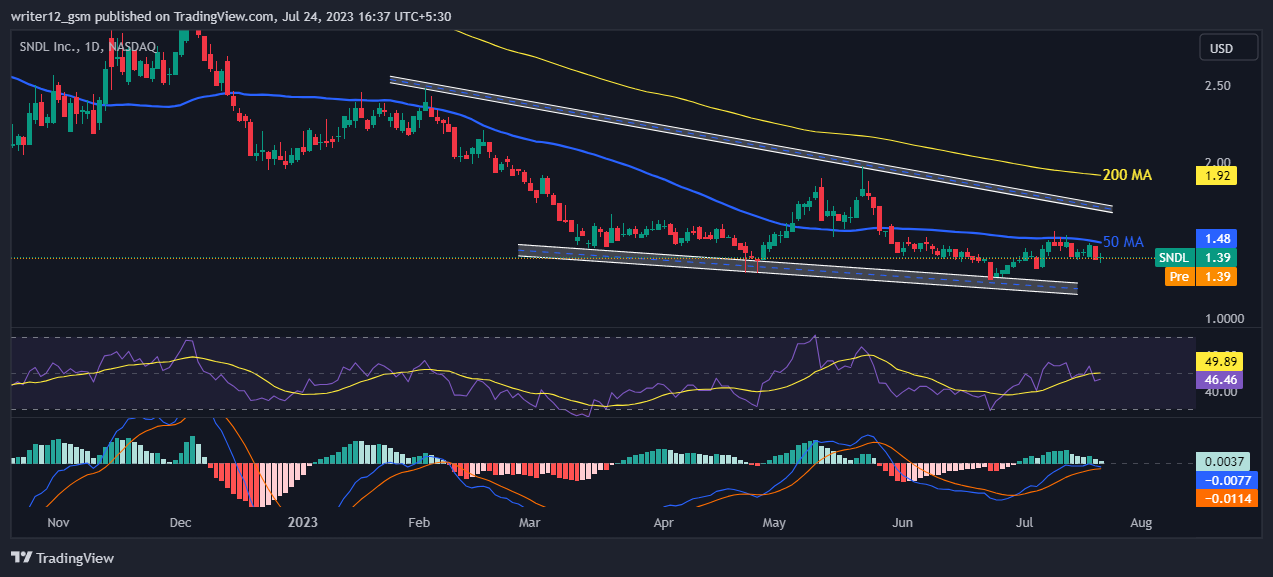
SNDL stock price is in a downtrend, forming lower lows patterns. However, it recently faced resistance at the 50 MA level. The stock price is trading below the 50-day and 200-day simple moving averages (SMA), indicating bearish momentum. The moving average convergence divergence (MACD) indicator is above the zero line, but the signal line has crossed below the MACD line, suggesting a possible bearish reversal. The relative strength index (RSI) is in neutral territory, showing weakness in price.
Summary
The company had a mixed Q1 2023 performance, with a strong year-over-year revenue growth but a lower quarter-over-quarter revenue and gross margin. The company also reduced its net loss compared to Q4 2022, but still reported a negative bottom line. The stock price is in a bearish trend, facing resistance and showing signs of weakness. Investors may want to wait for a clear breakout or breakdown before taking a position.
Technical Levels
- Support Level – The current support level is $1.23.
- Resistance Level – The current resistance level is $1.72.
Disclaimer
This article is only for information and education purposes. Do not use this information as financial or trading advice. Trading and investing have financial risks. Before making any investment or trading decision, please think about your risk tolerance and situation.

Nancy J. Allen is a crypto enthusiast, with a major in macroeconomics and minor in business statistics. She believes that cryptocurrencies inspire people to be their own banks, and step aside from traditional monetary exchange systems. She is also intrigued by blockchain technology and its functioning. She frequently researches, and posts content on the top altcoins, their theoretical working principles and technical price predictions.


