
 Home
Home News
News
- 1 Exxon Mobil Price increased by 4.72% over the past seven days.
- 2 Exxon Mobil Corporation (NYSE: XOM) stock’s 52-week price range is $98 to $119.
The oil and gas industry saw its earnings grow by 22.3% per year on average, but Exxon Mobil Corporation has outperformed it with a 19.9% annual growth rate in earnings. Simplywall Inc., a financial website that offers stock analysis and insights, reports that Exxon Mobil stock’s revenues have also increased by an average of 7.7% per year. The company has around 30.8% high return on equity and a net margin of 15.5%.
The debt-to-equity ratio of Exxon Mobil Corporation is 20.1% which means it has $41.4 Billion of debt and $206.4 Billion of equity. Simplywall Inc. states that the company has $369.4 Billion in assets and $163.0 Billion in liabilities. Exxon Mobil Stock’s EBIT is $77.0 Billion which gives it an interest coverage ratio of 100.1. It also has $32.7 Billion of cash and short-term investments.

The market capitalization of Exxon Mobil Corporation is $427.263 Billion and the total revenue is $400.44 Billion. Moreover, the stock’s basic EPS is $14.82 and the price-to-earnings ratio is 7.14. The average volume is 47.857K and the current volume is 305.318K, the current volume is above average volume in XOM stock.
The stock has done well this month, increasing by 3.01% but it has plummeted by 7.88% in the last six months. Exxon Mobil Corporation (NYSE: XOM) stock has a negative year-to-date return of 3.73% and a positive 1-year return of 19.87%.
Technical analysis of Exxon Mobil price in a 1-D time frame
The price action shows that Exxon Mobil Corporation (NYSE: XOM) price dropped by 15% in three weeks in April 2023, from a resistance level of $119.85 to a low of $102.15, making lower highs and lower lows.
The XOM price followed the trendlines of support and resistance closely and was in a range-bound situation for months. The XOM Price bounced back from a major support level of $100.22 and started an uptrend, making higher highs and lows, thereafter.
At the time of publishing, the XOM price is trading at $105.68. It seems that the buyers have increased their buying sentiment. Moreover, in the long-term view, the coin may be forming a bullish pattern, which is a falling wedge and may break out soon.
Therefore, to move upwards, the XOM stock price needs to gather more buying power in the longer trend. However, if the XOM price fails to sustain the current market price level, then it may go downwards reaching the support levels of $100.22 and $96.83. Alternatively, if the XOM stock price succeeds in sustaining the CMP level, then it may go upwards reaching the resistance levels of $110.40 and $113.91.
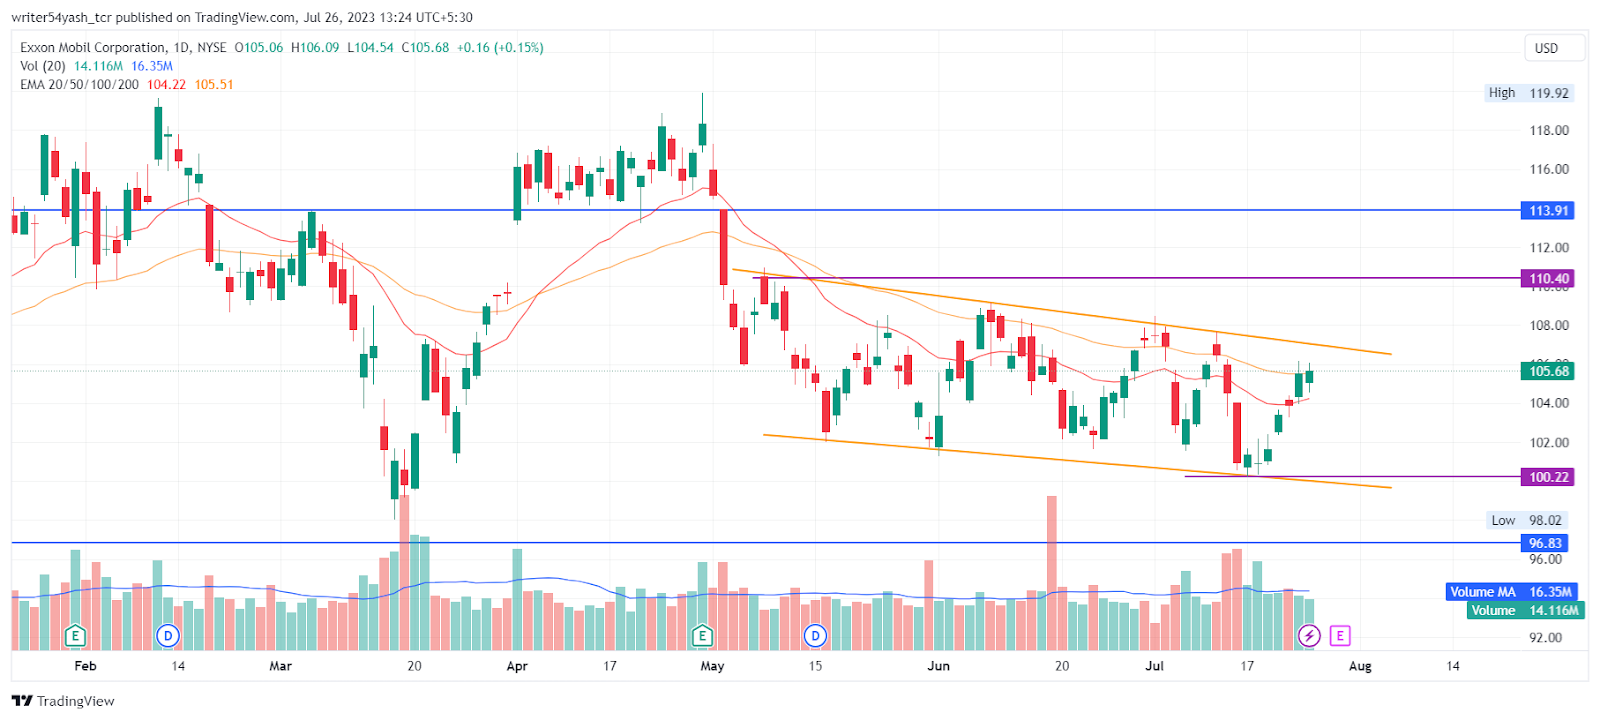
At the time of publishing, Exxon Mobil Corporation is trading below the 100, and 200-day EMAs (Exponential Moving Average), which are rejecting the Exxon Mobil stock price longer-trend.
However, the XOM price is trading above 20 and 50-day EMAs which are supporting the Exxon Mobil stock price shorter-trend.
Hence, Exxon Mobil price is expected to move upwards if longer EMA’s are destroyed one by one over the daily time frame chart.
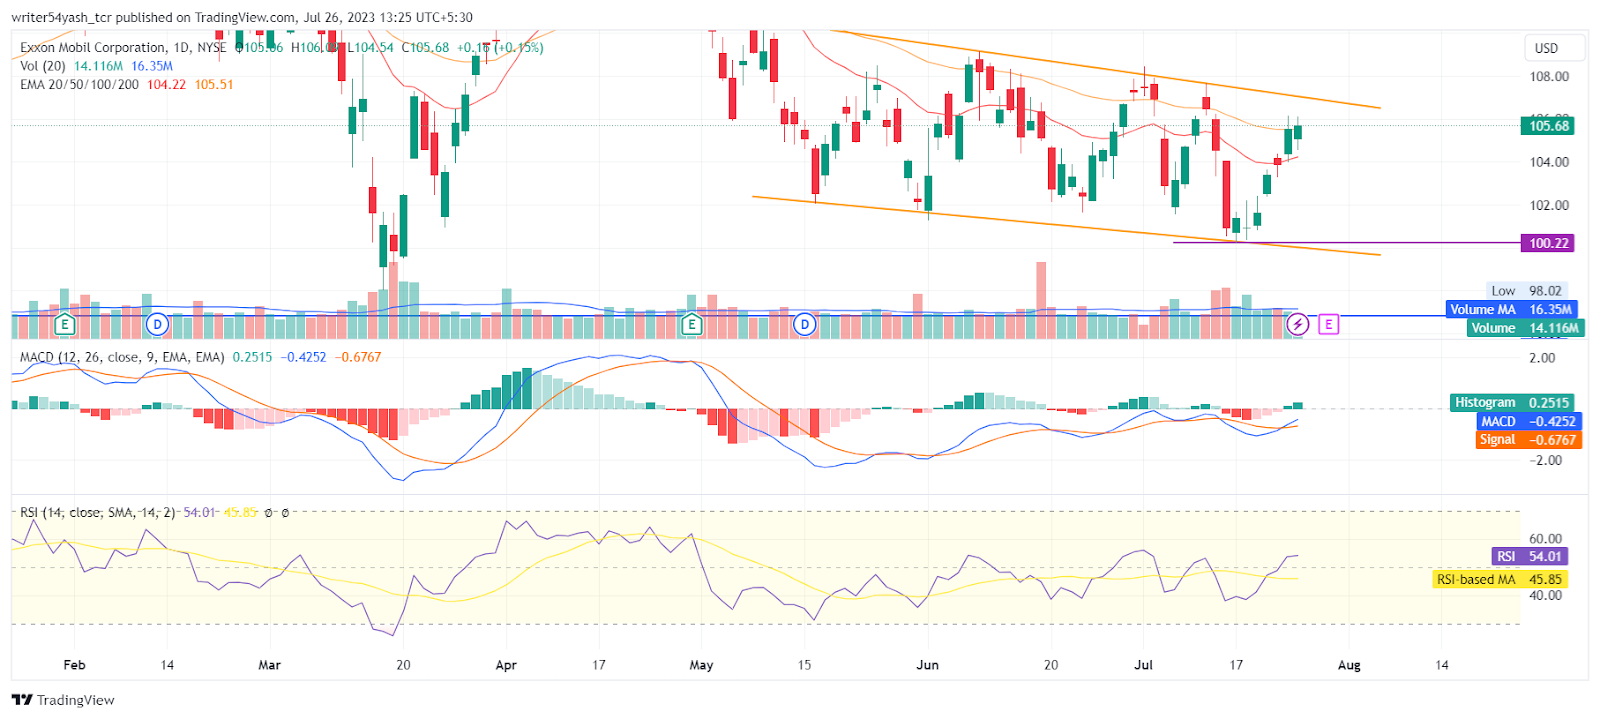
The current value of RSI is 54.01 points. The 14 SMA is near the median line at 45.85 points which indicates that the XOM share price is bullish as the RSI line took support from the 14 SMA line.
The MACD line at 0.4252 and signal line at 0.6767 are below the zero line and a bullish crossover was observed in the MACD oscillator which signals more bullishness for the XOM share price.
Summary
Exxon Mobil Corporation (NYSE: XOM) shows that the investors and traders of the stock are bullish on the 1-D time frame. The price action shows a bullish outlook at the time of publishing. The technical parameters of the XOM stock price also support the bullish trend. The major indicators MACD, RSI, and EMA are giving positive signals and imply that the uptrend may continue in Exxon Mobil Price.
Technical Levels
- The nearest support levels are $100.22 and $96.83.
- The nearest resistance levels are $110.40 and $113.91.
Disclaimer
In this article, the views and opinions stated by the author, or any people named are for informational purposes only, and they don’t establish the investment, financial, or any other advice. Trading or investing in cryptocurrency assets comes with a risk of financial loss.

Nancy J. Allen is a crypto enthusiast, with a major in macroeconomics and minor in business statistics. She believes that cryptocurrencies inspire people to be their own banks, and step aside from traditional monetary exchange systems. She is also intrigued by blockchain technology and its functioning. She frequently researches, and posts content on the top altcoins, their theoretical working principles and technical price predictions.


