
 Home
Home News
News
- 1 General Electric stock price closed at $117.16 while observing a gain of 6.27% during the last intraday session.
- 2 The 20-day Exponential moving average is acting as a support for GE stock price.
- 3 The year-to-date return of General Electric stock is 78.63%.
GE stock price has been explosive since the start of 2023, rising from the low of $65.19 and forming the current annual high at $117.96. The stock price has been forming higher lows with slight retracement since the start of the year. The storied manufacturer has provided a year-to-date return of 78.67% while the S&P YTD return is 18.96%.
Recently, General Electric stock price formed support at $107 and started to rise but faced several rejections from $112. After rejection, the stock price declined and formed support near $109.70.

On 25 July 2023, General Electric released its quarter 2 earnings which crushed the consensus estimate and the stock price surged 6.27% in the last trading session. The company has also lifted its full-year guidance due to solid demand from its aerospace business and record orders in its renewal energy division.
GE has also lifted its free cash flow estimates to a range of $4.1 Billion to $4.6 Billion from its previous estimate of $3.6 Billion to $4.2 Billion. The manufacturer also cited the rising demand for jet engines and wind energy turbines.

Analyst estimates by FactSet, an American financial data company, state that GE is on the journey of generating $61 Billion in revenue this year. The company also said that it would buy back all the outstanding preferred shares for about $2.8 Billion on September 15 2023 to simplify the company’s balance sheet.
Since Larry Culp, current CEO of General Electric, took over the industrial conglomerate, the stock price has been up by 65% and is charging toward six-year highs.
If the bullish momentum prevails, the next candle can shatter the high of the last candle. The price might head toward the next resistance level of $124 causing a rise of roughly 5.11%.
Will GE Stock Price Retrace Before Making a Bullish Move?
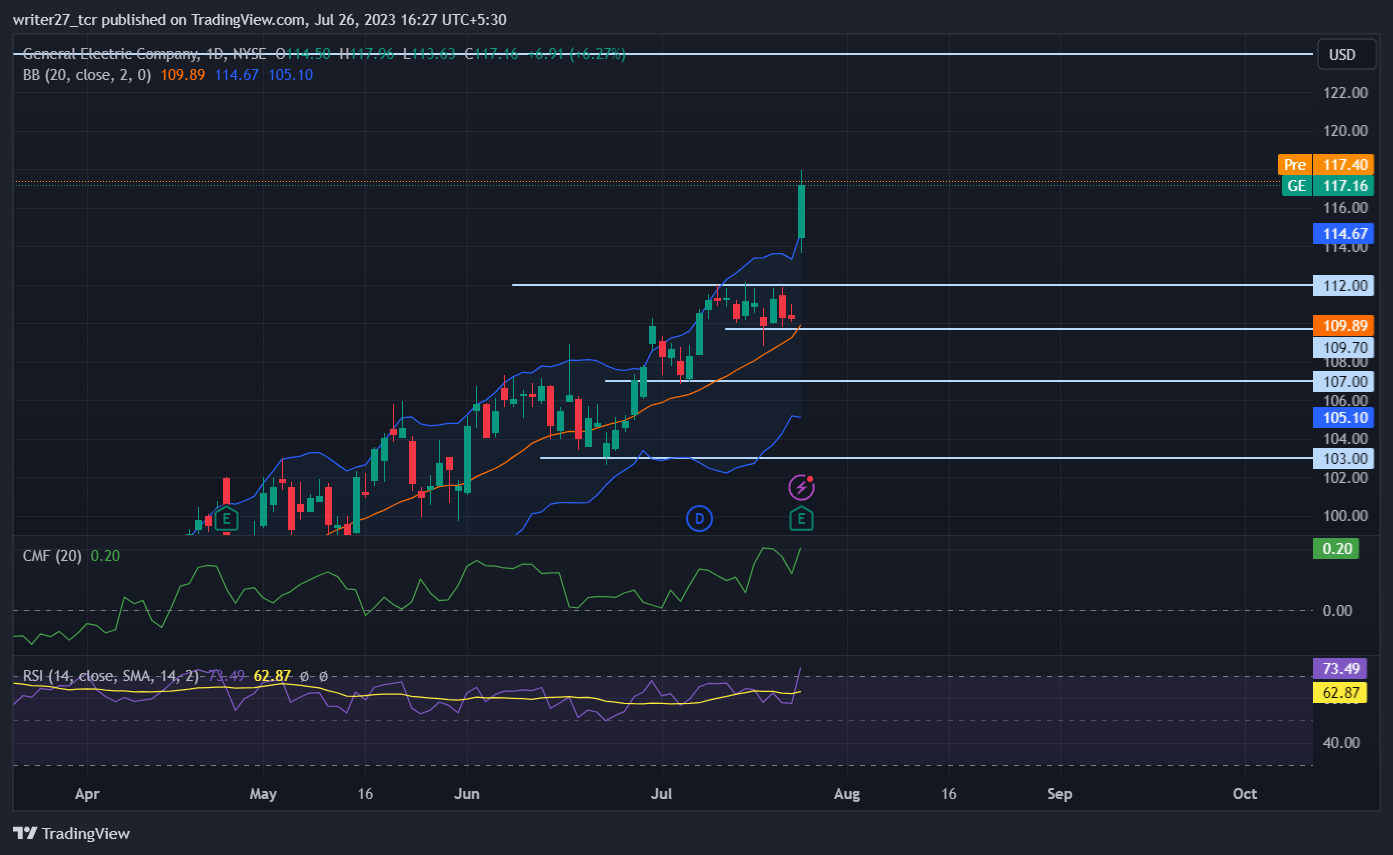
The stock price traded above the 20,50,100 and 200-day exponential moving averages (EMAs), indicating strong bullish momentum. Additionally, the Chaikin money flow score is 0.20 implying strength in the market and it has been above the 0 mark since the start of July 2023.
However, the relative strength index has entered into the overbought zone and currently stands at 73.49, signifying the possibility of a short-term pullback. The price is in strong momentum and might consolidate before attempting any downside move.
The stock price has also crossed the upper band of Bollinger which also indicates the possibility of pullback and the bands have started to expand showing a rise in volatility.
Conclusion
Technical indicators show that GE stock price is in bullish momentum. The crushing of consensus estimates has fueled the uptrend.
Technical Levels
- Major support levels: $107 and $103
- Major resistance levels: $124 and $130
Disclaimer
The views and opinions stated by the author, or any people named in this article, are for informational purposes only. They do not establish financial, investment, or other advice. Investing in or trading crypto assets comes with a risk of financial loss.
Mr. Pratik chadhokar is an Indian Forex, Cryptocurrencies and Financial Market Advisor and analyst with a background in IT and Financial market Strategist. He specialises in market strategies and technical analysis and has spent over a year as a financial markets contributor and observer. He possesses strong technical analytical skills and is well known for his entertaining and informative analysis of the Financial markets.


