
 Home
Home News
News
- 1 The S&P 500 Index price is trading at $4537.40 currently with a market capitalization of $2.636 Billion.
- 2 SPX index gave more than 14.83% return to their investors in a year.
The S&P 500 index, or Standard & Poor’s 500 index, is a stock market index that tracks the performance of 500 largest publicly traded companies in the United States. The index covers about 80% of the total market value of the U.S. stock market and is widely regarded as the best gauge of large-cap U.S. equities. The index was launched in 1957 by the credit rating agency Standard and Poor’s.
The S&P 500 index ended at $4,537.40 falling slightly by 0.64% from the previous day. The index has risen 17.75% year-to-date, reflecting the robust recovery of the U.S. stock market from the pandemic-induced downturn. The index hit its all-time high of $4,536.95 on July 16, 2023, and its 52-week low of 3,233.94 on July 24, 2022.

Weekly Analysis of the SPX Index
The price of the S&P 500 Index. has broken above the 50 and 200-day moving averages in the weekly chart, signaling strong bullish momentum. The market sentiment is positive about SPX’s performance. Additionally, the weekly RSI and MACD are also supporting the bulls.
SPX index Price Technical Analysis
S&P 500 Index. is exhibiting bullish momentum as its price has moved above the 50-day and 200-day moving averages. The price could initiate a new uptrend and move higher if the buying pressure continues. Furthermore, the bullish signal on the daily chart validates the positive outlook.
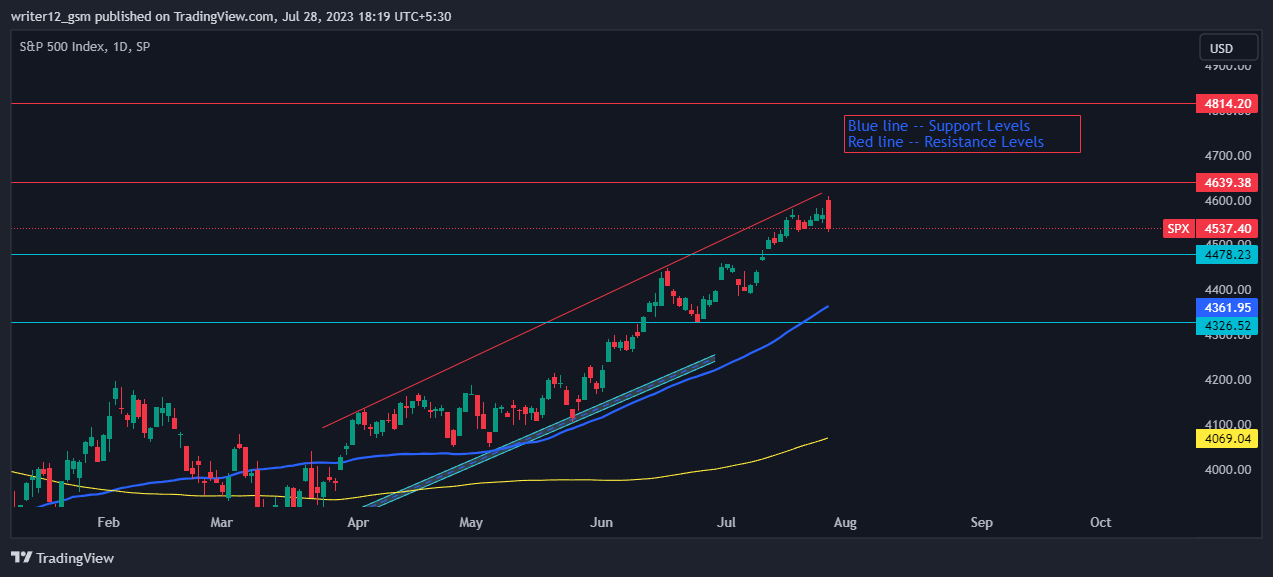
SPX index chart is showing mild bullish signs based on the technical indicators MACD, RSI, and super trend. The MACD line has crossed below the signal line, indicating mild bearishness. The RSI is above 50, showing a positive trend. The super trend line is below the price, suggesting a trend reversal. These indicators suggest that the SPX index is in a mild bullish trend and may continue to rise if buyers support the price.
Conclusion
S&P 500 Index is making new records while it displayed an increase in earnings. SPX reached higher highs and broke above the 50- and 200-day moving averages on daily and weekly time frames. The RSI, MACD, moving averages and super trend are all bullish, indicating a strong uptrend.
Technical Levels:
The chart indicates that the price encountered strong resistance at $4639.00 and $4814.00, and strong support at $44784.00 and $4326.00. A break above or below these levels could indicate a new trend direction.
Disclaimer
The price prediction provided in this article is for informative and educational use only. Do not use this information as financial, investment, or as a trading recommendation. Investing and trading in the index is a risky task. Please consider your circumstances and risk profile before making any investment decisions.

Andrew is a blockchain developer who developed his interest in cryptocurrencies while pursuing his post-graduation major in blockchain development. He is a keen observer of details and shares his passion for writing, along with coding. His backend knowledge about blockchain helps him give a unique perspective to his writing skills, and a reliable craft at explaining the concepts such as blockchain programming, languages and token minting. He also frequently shares technical details and performance indicators of ICOs and IDOs.


