
 Home
Home News
News

- 1 Polkadot price prediction suggests a rise in the long run.
- 2 DOT price consolidating in a narrow range for base formation.
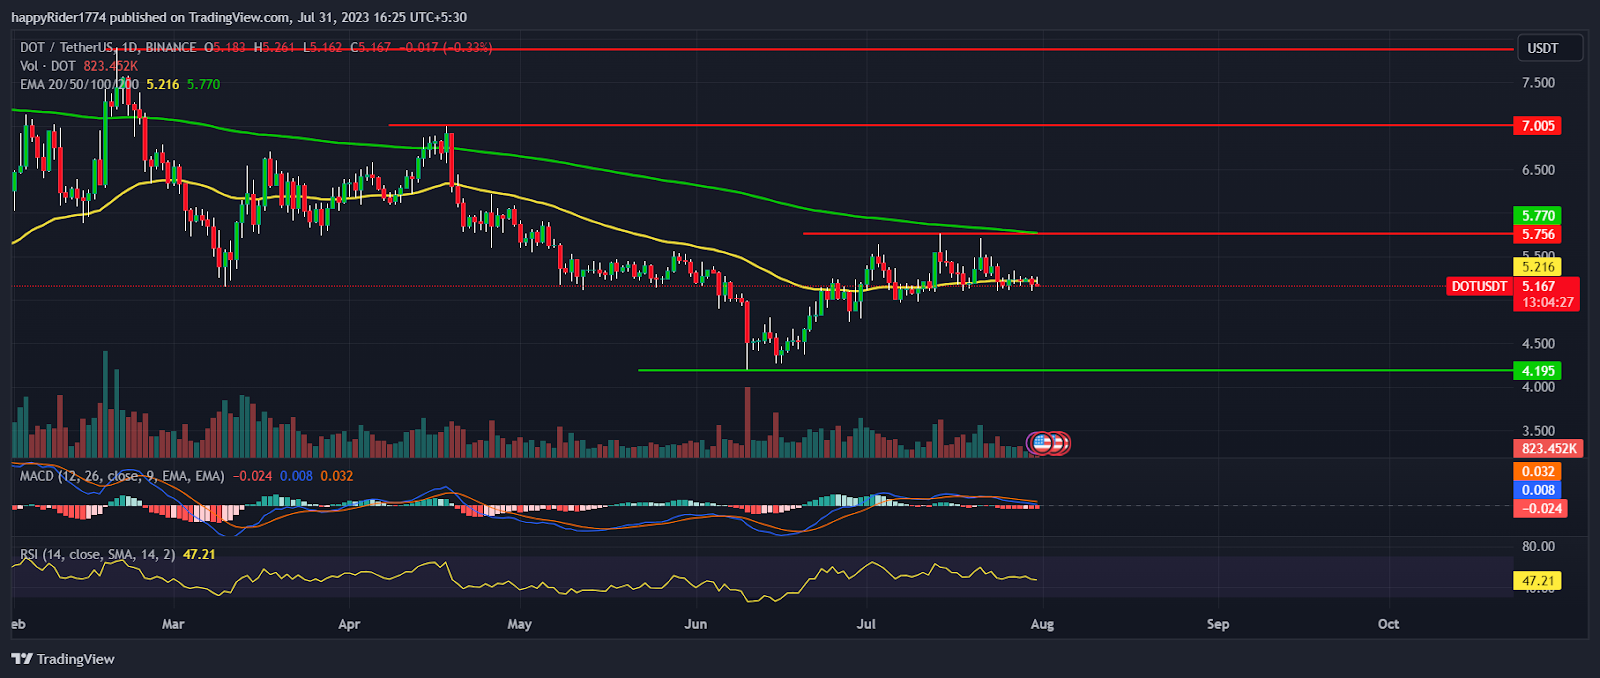
- 3 Polkadot crypto price struggles to climb above the 50-day EMA.
Polkadot price prediction suggests that it remains bullish till it holds $4.500 support and suggests a rise in the long run. DOT price recovered 25% (approx.) from the recent swing low and buyers are trying to reverse the short-term trend.
Polkadot price faced rejection from the 200-day EMA and struggles to climb above the 50-day EMA. It shows that the sellers are still active on the higher levels.

In the mid of June, Polkadot crypto price dropped below $5.00 which triggered panic selling. However, sellers failed to give the follow-through momentum and prices showed a sharp bounce. Slow and steady prices recovered and buyers succeeded to regain the 50-day EMA.
Presently, the DOT price is stuck in a narrow range between $5.00 to $6.00. Buyers tried multiple times to break out of the higher range and expand upward but got rejected. It shows the sellers’ dominance in the supply zone.
Polkadot price is trading at $5.167 with an intraday decline of -0.33%. The 24-hour volume to market cap is 1.75%. The pair of DOT/BTC is trading at 0.0001758 with an intraday decline of -0.79%.
Polkadot Price formed a strong base
Polkadot price prediction suggests a significant increase in value is possible in the coming months. If the crypto leader, BTC price recovers and buyers are able to regain the $30K mark. Then it will improve the market sentiment which might positively impact the prices of other Altcoins.
Till the Polkadot price is sustained above $4.500 the probability of upward range expansion is high. However, if the price drops below $4.500 then bear may try to drag it down to the yearly lows.
The technical analysis suggests DOT Price formed a strong base near $4.500 and downside risk is low.
DOT Price Analysis on a weekly time frame
DOT price formed a bearish candle in the weekly time frame. It shows sellers are more active as compared to buyers.
The MACD curve displayed a negative crossover but sloping sideways. It indicates prices might spend some more time in the consolidation. The RSI at 47 slopes down denotes weakness. If the prices decline further then RSI might test the oversold territory.
Conclusion
Polkadot price prediction suggests a significant rise in the DOT price is possible. However, for the short term prices seem to be mildly bearish. The technical analysis suggests Polkadot Price formed a strong base near $4.500 and the downside looks limited.
Technical levels
- Resistance levels: $6.00 and $7.00
- Support levels: $5.000 and $4.500
Disclaimer
The views and opinions stated by the author, or any people named in this article, are for informational purposes only. They do not establish financial, investment, or other advice. Investing in or trading crypto assets comes with a risk of financial loss.

Adarsh Singh is a true connoisseur of Defi and Blockchain technologies, who left his job at a “Big 4” multinational finance firm to pursue crypto and NFT trading full-time. He has a strong background in finance, with MBA from a prestigious B-school. He delves deep into these innovative fields, unraveling their intricacies. Uncovering hidden gems, be it coins, tokens or NFTs, is his expertise. NFTs drive deep interest for him, and his creative analysis of NFTs opens up engaging narratives. He strives to bring decentralized digital assets accessible to the masses.


