
 Home
Home News
News
- 1 BTC price showed a fake breakout in the past sessions.
- 2 Buyers are attempting to surpass the resistance mark of $30K.
Bitcoin (BTC) price trading below the crucial barrier of $30k, and sellers maintained their grip by tightly preventing the range. However, mighty bulls continuously tried to overtake the spot but failed to surpass it. In the last month, BTC price showed a breakout of the falling wedge pattern and rallied toward $31K, but buyers did not sustain there and showed a retracement toward $29K.
At the moment, Bitcoin (BTC) technical parameters indicate the buyers are accumulating the price and looking to retest the $30K mark soon. However, the price is close to the 100-day EMA, and a bounce can be anticipated. Moreover, BTC price trading inside the rising wedge pattern took support at $28500 and showed a bounce.
However, the BTC price was noted as a fake breakout on the charts, and buyers were trapped in the last sessions, trying to attain a bounce to unwind their long positions, indicating a rebound toward $30K in the upcoming sessions.
At press time, Bitcoin (BTC) price is trading at $28,911 with an intraday drop of 1.58% showing neutral indications. Moreover, the trading volume increased by 2.32% to $14.43 Billion. However, the market capitalization of BTC is $561.86 Billion. The intraday high of BTC is $29,468.88, and the intraday low is $28,835.13 showing a failure to sustain above $29K.
Bitcoin Price Action On Daily Charts
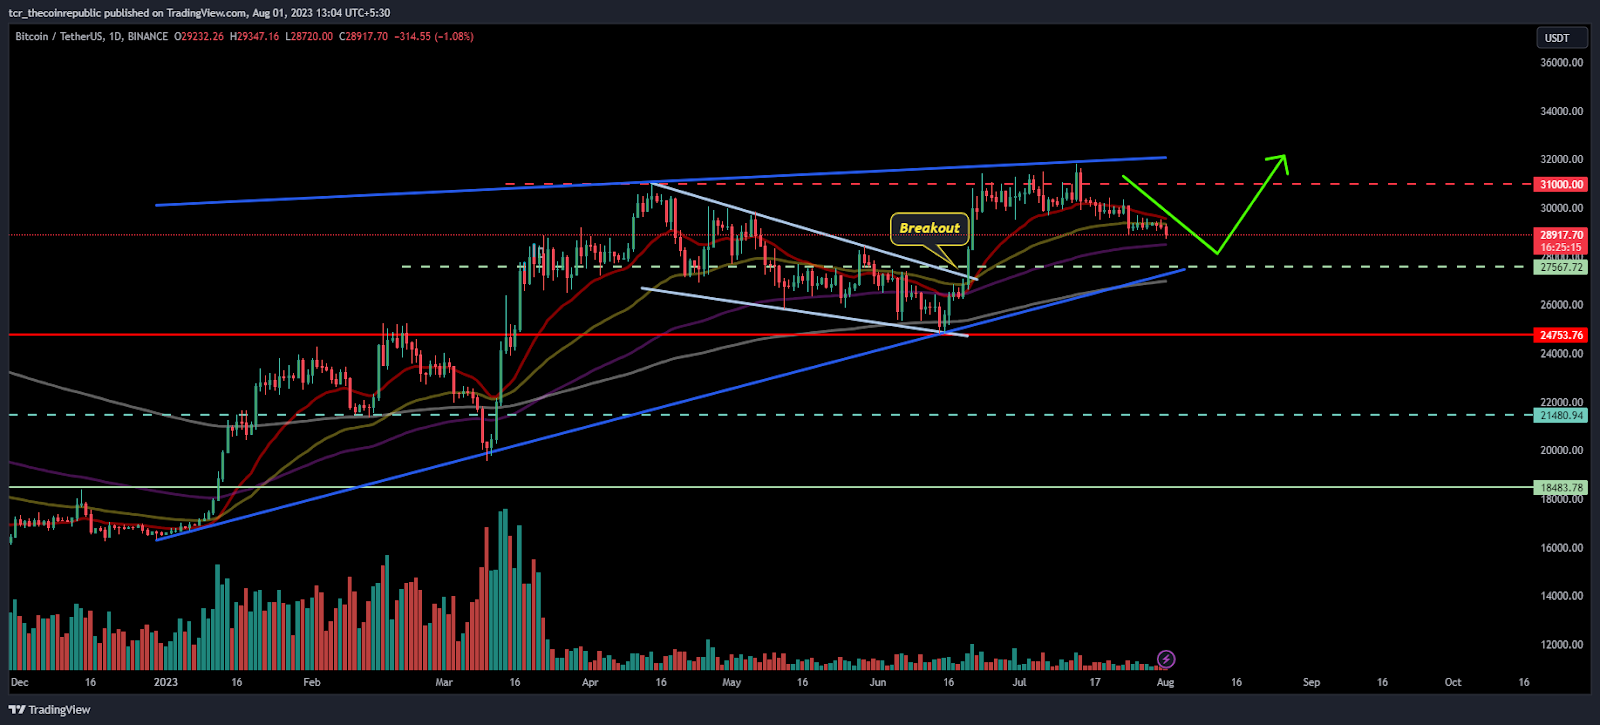
On the daily charts, Bitcoin price stayed in a narrow range between $28K – $31K from the past sessions. The price action shows that the battle between the bulls and bears shows equal interest, but neither the bulls nor the bears were stretching the price towards the aim. However, a bounce can be anticipated from the 100-day EMA, and a rise toward $31K will soon be fetched.
As per the Fib levels, the Bitcoin price traded above 50% and could not escape 61.8%. Moreover, the price is near the lower bollinger band, indicating selling pressure from the top of $31K.
Short Term Charts Indicates A Bounce
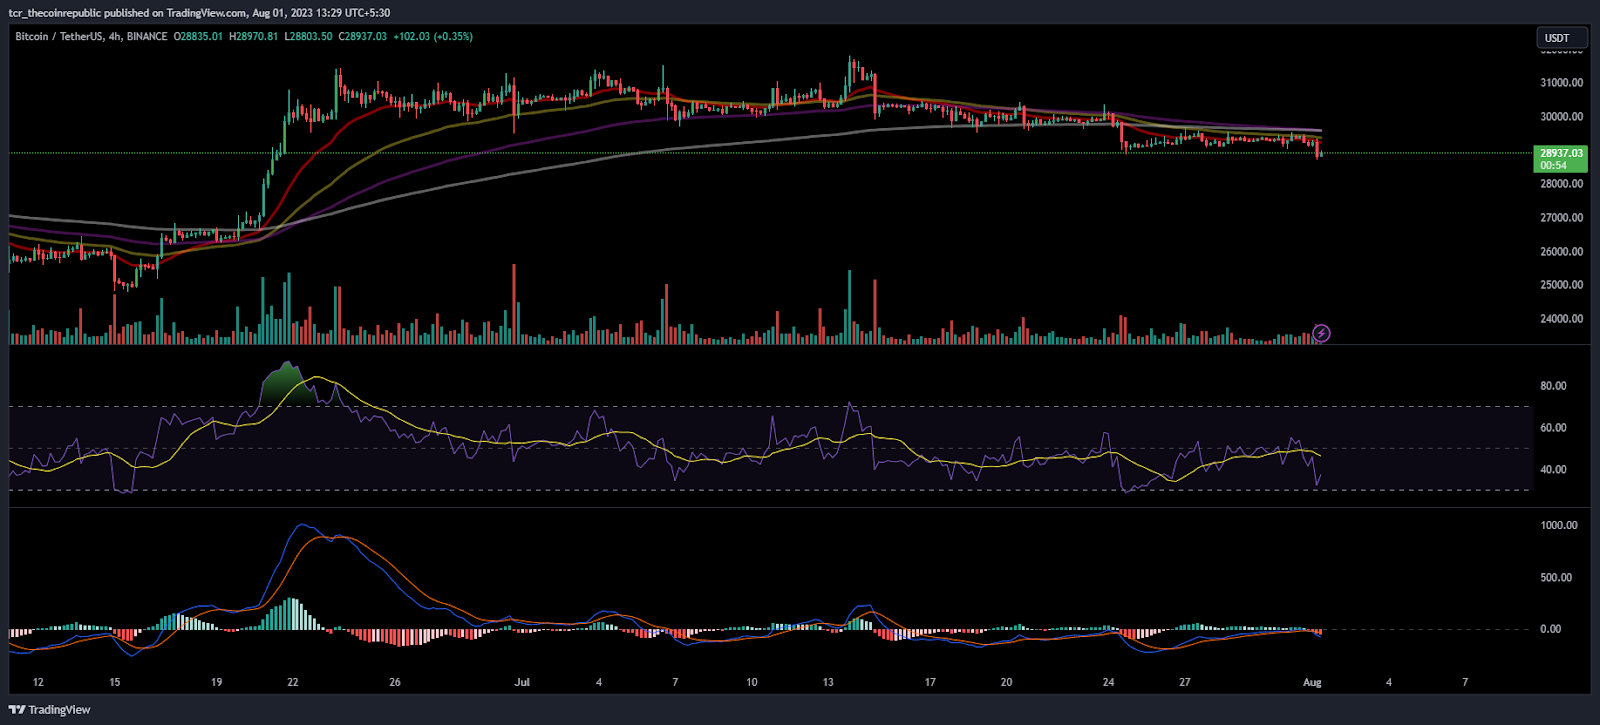
On the 4-hour charts, the BTC price is consolidating below $30K, the leading indicators are near the seller region, and the price slipped below the key MA.
The RSI curve is in the oversold region and looks for a bounce in the upcoming session. Moreover, technicals are not favoring further drop below $28K and further retest toward the highs of $30K followed by $31K can be attained.
The MACD indicator showed a bearish crossover, and red bars were noted on the histogram, which showed buyers losing their strength.
Conclusion
Bitcoin (BTC) price shows sellers’ attainability who persisted in making short positions and did not permit them to escape the round spot of $30K from the past sessions. However, the bulls are willing to retest it soon.
Technical Levels:
Support Levels: $26600 and $28000
Resistance Levels:$30350 and $31000
Disclaimer
The views and opinions stated by the author, or any people named in this article, are for informational purposes only and do not establish financial, investment, or other advice. Investing in or trading crypto assets comes with a risk of financial loss.
Steve Anderson is an Australian crypto enthusiast. He is a specialist in management and trading for over 5 years. Steve has worked as a crypto trader, he loves learning about decentralisation, understanding the true potential of the blockchain.


