
 Home
Home News
News
- 1 Qualcomm stock price (NASDAQ: QCOM) was up by 11.03% in the previous month.
- 2 QCOM stock price is sustaining above the 50 day and the 200 day EMA showcase uptrend.
- 3 Qualcomm Inc. is expected to release the quarterly earnings on August 2, 2023.
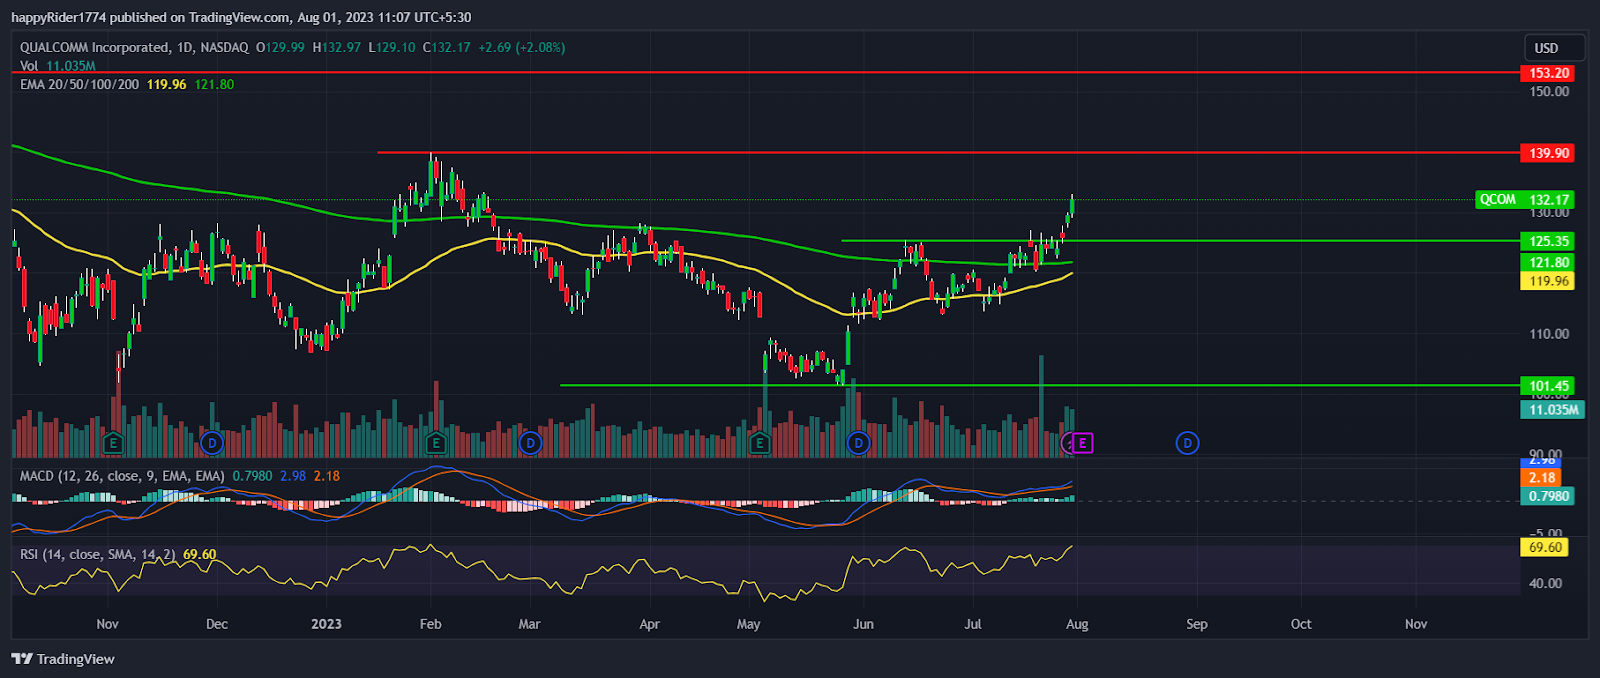
Qualcomm stock price (NASDAQ: QCOM) rallied 11% approx in the previous month and breakout of $125.00 hurdle. QCOM stock is rising upward and forming a bullish continuation pattern.
Qualcomm stock price managed to climb above the 50 day and the 200 day EMA, showcasing that the trend has reversed upward. However, the price looks mildly over stretched so a minor retracement to the 50 day EMA is possible.
In the end of May, QCOM stock took support near $101.00 and prices formed a bullish engulfing candle. Later, the buying volume also increased and prices began to rise by forming higher highs.
In the mid of June, Qualcomm stock attempted to break the $125.00 hurdle. But due to the strong presence of sellers, prices faced rejection and witnessed profit booking.
However on the lower side, $112.00 acts as a strong support and prices again bounce back with strong momentum. Recently, Qualcomm stock succeeded to break the $125.00 hurdle, which triggered the positive sentiment.
Qualcomm stock price closed the previous session $132.17 with an intraday rise of 2.08%. The market capitalization stands at $147.24 Billion.
Will Qualcomm Stock Continue the Rally?
Qualcomm stock (NASDAQ: QCOM) performed well in the past few months and is up by 23.29% on YTD basis. Genuine investors seem to be turning bullish and are expecting to outperform in the coming months.
Qualcomm Inc. scheduled the quarterly earnings on August 2, 2023. Market analysts estimated an EPS of 1.807 and revenue of $8.508 Billion.
After analyzing past results, one can say that QCOM will beat the analyst estimates due to which the stock might react positively. Till QCOM shares hold the $125.00, the rally might continue to $150.00.
QCOM Stock Price Analysis on Weekly Time Frame
QCOM stock price rose for four consecutive weeks which shows the dominance of buyers. The support levels have shifted higher, indicating buyers are more active as compared to sellers.
The MACD curve slopes upward and displays a positive crossover, indicating bullish momentum might continue. The histogram bar is green, which confirms the strength of the bulls. The RSI at 70 is near to an overbought territory, which may raise concern for the bullish traders.
Conclusion
Qualcomm Stock (NASDAQ: QCOM) is trading with the bullish cues ahead of quarterly earnings. Technical analysis suggests, Till QCOM stock holds $125.00 the bullish momentum might continue and may reach $150.00.
Technical levels
- Resistance levels: $140.00 and $153.00
- Support levels: $125.00 and $115.00
Disclaimer
The views and opinions stated by the author, or any people named in this article, are for informational purposes only. They do not establish financial, investment, or other advice. Investing in or trading crypto assets comes with a risk of financial loss.

Andrew is a blockchain developer who developed his interest in cryptocurrencies while pursuing his post-graduation major in blockchain development. He is a keen observer of details and shares his passion for writing, along with coding. His backend knowledge about blockchain helps him give a unique perspective to his writing skills, and a reliable craft at explaining the concepts such as blockchain programming, languages and token minting. He also frequently shares technical details and performance indicators of ICOs and IDOs.


