
 Home
Home News
News
- 1 RNDR token slipped below the lower trendline and showed a breakdown in the last sessions.
- 2 Render token is near the 200-day EMA, showing weakness on the charts.
Render (RNDR) token price showed a breakdown and slipped below the rising channel’s lower trendline, suggesting weakness on the charts. Moreover, the price paused near the 200-day EMA and waited for a decisive move. If it slips, it will lead to a free fall toward the trajectory of $1.00 and, if it bounces, it will catch $2.00.
However, sellers attained strong momentum and continued leading the past sessions’ fall. This gradual decline in token price led buyers into trouble, which led to long unwinding moves that gave an advantage to sellers for spreading further breakdown in the following sessions.

The price action shows that the RNDR token price is consolidating near the 200-day EMA and struggling to hold the gains. Moreover, the charts show a negative outlook based on the short buildup activity and lower trading volume.
Since 2023, the RNDR token has recovered from the lows of $0.400. The bulls accumulated gains taking the token to the high of $3.000. After multiple efforts, buyers could not surpass the range leading to rejection and gradual decline, which was still in action, and sellers continued to dominate.
At press time, the RNDR token price is trading at $1.76 with an intraday drop of 1.35% showing bearishness on the charts. Moreover, the intraday trading volume increased by 2.53% to $21.61 Million, and the pair of RNDR/BTC is at 0.000060 BTC. The market cap of the RNDR token is $936.62 Million.
RNDR Token Shows Negative Outlook On Daily Charts
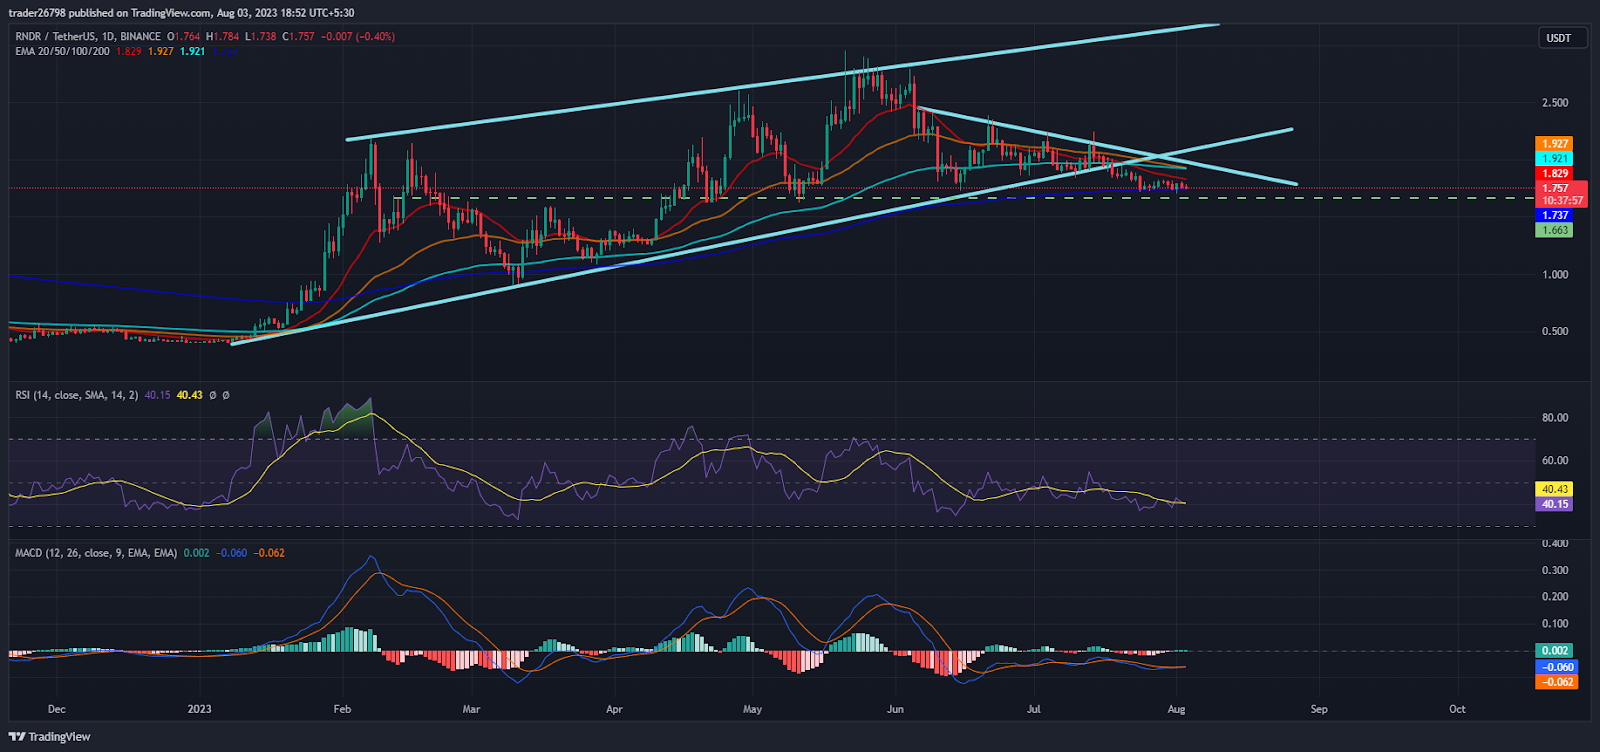
The daily charts show that the RNDR token price chart was broken and struggled to reach the 200-day EMA. Furthermore, the price action shows that sellers are gaining momentum and are trying to take RNDR to $1.50 in the following sessions.
As per the Fib levels, the RNDR token price is near 38.2% and stayed in the selling region. Moreover, the price hangs near the lower bollinger band, indicating weakness on the charts.
The RSI curve showed negative divergence and stayed in the oversold region near 38. Moreover, the technicals indicate a fall in the upcoming sessions.
The MACD indicator shows the convergence of moving averages and a neutral chart structure.
Conclusion
Render token (RNDR) price is struggling to hold the gains and hovering near the 200-day EMA showing a weak chart structure. Moreover, the leading indicators show bearish cues, as the sellers try to expand the fall toward the round mark of $1.50.
Technical Levels:
Support Levels: $1.50 and $1.20
Resistance Levels:$2.00 and $2.20
Disclaimer
The views and opinions stated by the author, or any people named in this article, are for informational purposes only and do not establish financial, investment, or other advice. Investing in or trading crypto assets comes with a risk of financial loss.

With a background in journalism, Ritika Sharma has worked with many reputed media firms focusing on general news such as politics and crime. She joined The Coin Republic as a reporter for crypto, and found a great passion for cryptocurrency, Web3, NFTs and other digital assets. She spends a lot of time researching and delving deeper into these concepts around the clock, and is a strong advocate for women in STEM.


