
 Home
Home News
News

- 1 Bitcoin is currently trading at $$29,508.53, with a price rise of 2.25% in the last 24 hours.
- 2 BTC has been consolidating for a long time in a tight range.
Bitcoin (BTC) has been trading around the 50-day simple moving averages, indicating a consolidation phase in the market. However, if buyers can sustain the upward pressure, BTC prices could rise further and enter an uptrend. Moreover, the bullish cross supports the positive outlook.

The MACD line at -111 and the signal line at -65 are in the negative territory, implying that the MACD is bearish. However, the signal line crosses below the MACD line and moves downward, signalling a loss of momentum.

The RSI line is at 48.46, which shows that the stock is in a bullish zone but not overbought. However, the 14-day simple moving average (SMA) line is at 46.28, suggesting a downward trend in the price.
The Supertrend indicator gives a green signal, confirming the bullish sentiment. This means that AAPL’s stock is likely to continue its upward trend, offering potential opportunities for traders and investors.
Technical Analysis of BTC Coin
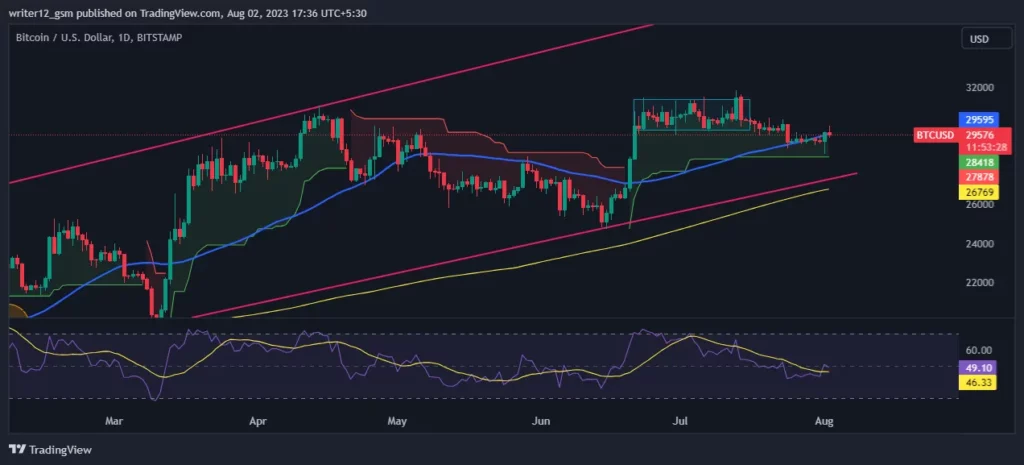
Bitcoin is in a consolidation phase, trading around the 50-day SMA. The technical indicators are inconclusive, with some showing bullish signs and some showing bearish signs. The price may break out of the tight range if buyers or sellers gain more strength. Traders and investors should watch the price action and the indicators closely for any signals of a trend change.
Technical Analysis of Quant Crypto
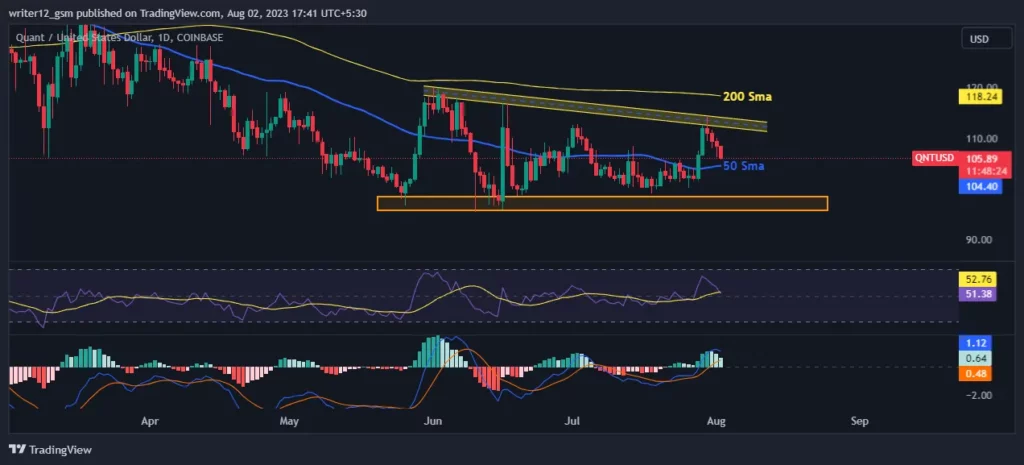
Quant is trading at $105.81, with a slight decrease of 2.21% in the last 24 hours. The quant price is moving between the 50 and 200 SMAs, indicating a sideways movement. However, it faced resistance from the trendline and reversed its direction towards the 50 SMA. The SMA lines are showing a neutral trend for now.
RSI is at 51.50 points, which is close to the middle line, and the 14 SMA is at 52.76 points, which is slightly above the RSI line. This suggests that the price is in a no-trading zone with no clear momentum.
MACD is in positive territory, implying that the price is bullish. The MACD line is at 1.12, and the signal line is at 0.48, which means that the MACD line is above the signal line, and the price is gaining strength.
Quant is in a consolidation phase, trading between the 50 and 200 SMA. The technical indicators are slightly bullish, with the MACD showing strength and the RSI and SMA showing no trading zone. The price may break out of the range if it can overcome the trendline resistance or the 50 SMA support. Traders and investors should monitor the price action and the indicators for any signs of a trend change.
Technical Analysis of IOTA (MIOTA) Crypto
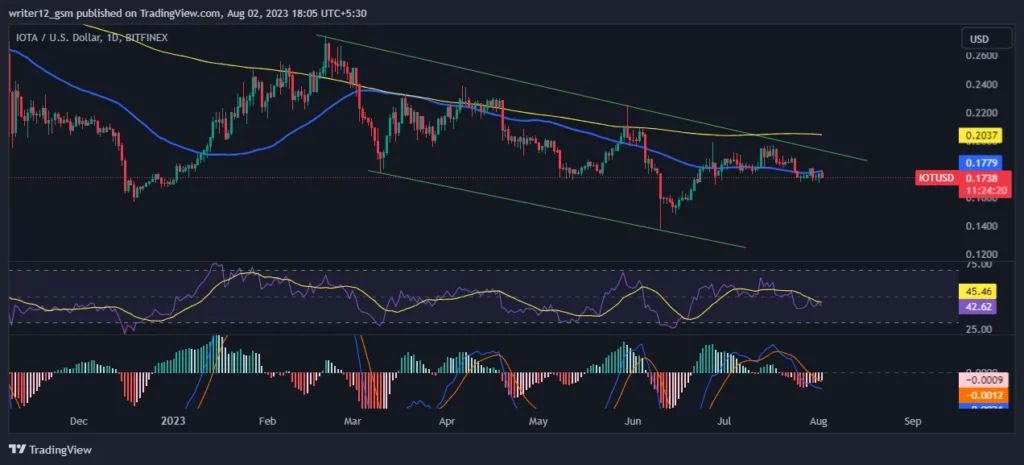
IOTA is trading at $0.1739, with a slight increase of 0.19% in the last 24 hours. The MIOTA price is moving between the 50 and 200 SMAs, indicating a sideways movement. However, it faced resistance from the trendline and reversed its direction towards the 50 SMA. The SMA lines are showing a neutral trend for now.
RSI is at 42.62 points, which is close to the middle line, and the 14 SMA is at 45.46 points, which is slightly above the RSI line. This suggests that the price is in a no-trading zone with no clear momentum.
MACD is heading toward negative territory, implying that the price is bearish. The MACD line is at -0.0021, and the signal line is at 0.0012, which means that the MACD line is above the signal line, and the price is gaining strength.
IOTA is in a consolidation phase, trading between the 50 and 200 SMAs. The technical indicators are slightly bullish, with the MACD showing strength and the RSI and SMA signalling ‘no trading zone.’ The price may break out of the range if it can overcome the trendline resistance or the 50 SMA support. Traders and investors should monitor the price action and the indicators for any signs of a trend change
Disclaimer
The information provided in this article is for educational purposes only and does not constitute investment advice. Technical analysis is based on historical patterns and trends and does not guarantee future results. Trading involves risks, and you should only invest what you can afford to lose.

Nancy J. Allen is a crypto enthusiast, with a major in macroeconomics and minor in business statistics. She believes that cryptocurrencies inspire people to be their own banks, and step aside from traditional monetary exchange systems. She is also intrigued by blockchain technology and its functioning. She frequently researches, and posts content on the top altcoins, their theoretical working principles and technical price predictions.


