
 Home
Home News
News
- 1 Verizon’s stock price is currently trading at $33.32 with a minor incline of 0.33% in the last 24 hours.
- 2 The VZ market capitalization is $144.365 Billion.
Verizon Communications Inc. is a leading wireless, broadband, and media provider in the U.S. and overseas.
Second Quarter Results
Verizon beat Wall Street estimates in its Q2 2023 earnings. The company reported a net income of $4.65 Billion, an EPS of $1.10, and an adjusted EPS, excluding special items, of $1.21.
However, the company’s earnings and revenues declined from the same quarter of last year. Adjusted earnings fell to $1.21 per share from $1.31 per share, and unadjusted profit dropped to $4.77 Billion or $1.10 per share from $5.32 Billion or $1.24 per share.
The company’s operating revenues also decreased 3.5% year-over-year to $32.60 Billion in the quarter. The Wireless Equipment segment dragged down the revenues, despite a slight increase in the Services and Other segments.
Verizon Stock Price Technical Analysis
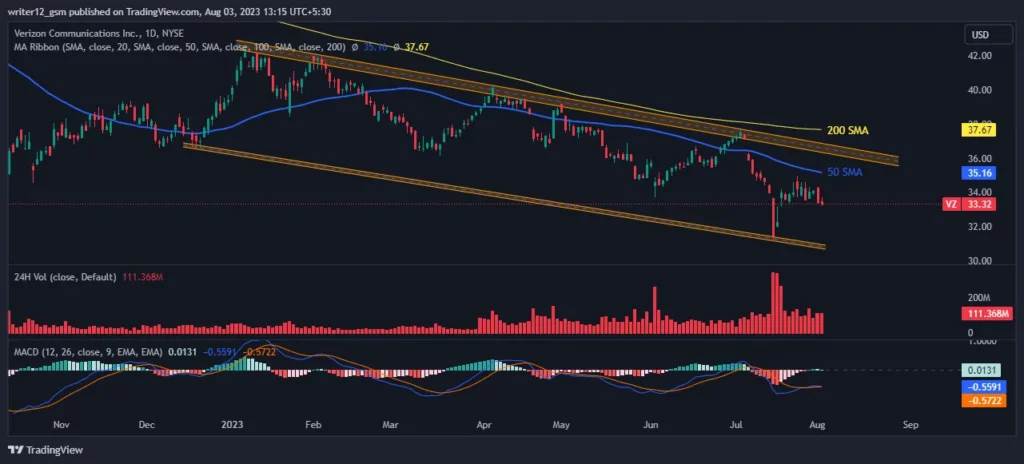
Verizon Communications stock is in a bearish trend and below the 50 and 200 EMAs. The stock may drop more next week if the sellers maintain control. The buyers have no strength to change their direction right now. The stock may meet some support at the previous lows or the round number of $30.00.
The RSI is at 40.33 points (press time) and below the 50 level, indicating that the market is bearish. The 14 SMA line is under the middle line, around 39.35 points, moving toward the overbought zone. RSI shows bullish sentiments in the market. The stock needs a bullish cross or a positive catalyst to rebound.
The MACD is also negative at -0.5591 and below the signal line at -0.5722, signaling more downside risk. The MACD is under the zero line, implying that the MACD is in the negative zone and is giving bearish signs.
Summary
VZ stock is in a downtrend and facing resistance from sellers at higher levels. The stock is close to the supply zone and may fall further if the sellers push it down. The stock needs to break above the resistance to start a bullish move. The investors are pessimistic about the stock price. The EMA, RSI, and MACD are also bearish on the Verizon Communications stock as of now.
Technical Levels:
- Support Level – $31.31.
- Resistance Level – $37.73.
Disclaimer
The analysis given in this article is for informational and educational use only. Do not take this information as financial or trading advice. Trading and investing contain financial risk. Before making any investment or trading decision, please consider your risk profile and circumstances.

Nancy J. Allen is a crypto enthusiast, with a major in macroeconomics and minor in business statistics. She believes that cryptocurrencies inspire people to be their own banks, and step aside from traditional monetary exchange systems. She is also intrigued by blockchain technology and its functioning. She frequently researches, and posts content on the top altcoins, their theoretical working principles and technical price predictions.


