
 Home
Home News
News
- 1 Stellar price prediction suggests buyers are active and bounce back possible.
- 2 XLM price sustained above the 50-day and 200-day EMA showcasing uptrend.
- 3 Stellar crypto price trying to hold the $0.1200 breakout.
Stellar price prediction is bullish and suggests decent rise is possible in the coming months. XLM price performed well in the previous month and displayed a massive breakout.
XLM crypto price succeeded to climb above the 50-day and 200-day EMA. It shows the positional trend has reversed in upward direction. So, any short downfall will be easily absorbed by the buyers.

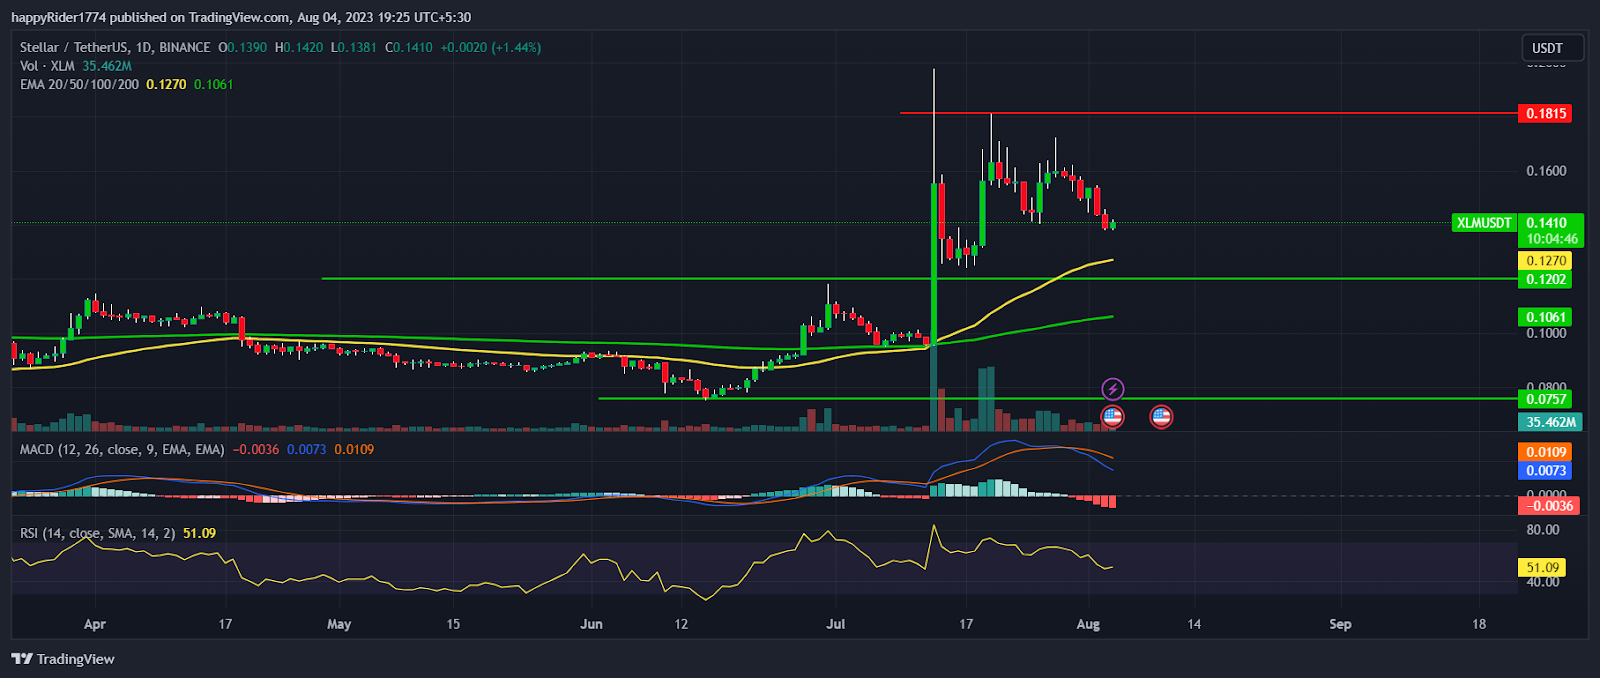
In the mid of July, XLM crypto witnessed a massive spike in buying volume and prices surged 61% in a single day.
It triggered the positive sentiment and created a hope for more upward momentum. Later, prices witnessed minor profit booking and retrace 50% of the breakout level.
Stellar price took support near $0.1200 and prices again bounced back and tested the previous highs. However, $0.1800 turned out as a strong hurdle and prices seem to be stuck into the wide range consolidation.
Presently, XLM price is retracing down and likely to test the EMAs in coming weeks. Stellar price is trading at $0.1410 with an intraday rise of 1.44%. The 24-hour volume to market cap is 3.50%.
Will Stellar Price bounce back from EMA support?
Stellar price prediction favors the bulls and suggests short-term rise is possible. The overall crypto market is recovering which might positively impact the prices of other Altcoins.
Till the XLM crypto price holds $0.1200 support, the possibility of bounce back remains high. As of now, the 50-day EMA will act as an immediate support for the bulls. Moreover, the next phase of the rally begin when buyers will succeed to break the $0.1800 hurdle.
Till then the XLM prices are expected to remain in consolidation. On the other hand, if the price drops below $0.1200 then signs of the short term bearish trend reversal might be visible.
XLM Price Analysis on Weekly Time Frame
XLM price formed a Doji candle on a weekly time frame indicating indecisiveness. Buyers seem to be more active as compared to sellers. Therefore, any positive news will fuel the rally in stock.
The MACD curve displayed a negative crossover and histogram bar is declining indicating mild bearishness. Whereas, the RSI at 50 denotes neutral territory and equal level of tug of war between buyers and sellers.
Conclusion
Stellar price prediction is bullish till it holds the $0.1200 support. The technical analysis suggests that XLM price is in bulls’ grip and probability of bounce back from the EMA is high. If prices bounce back it might retest the July month highs.
Technical levels
- Resistance levels: $0.1800 and $0.2000
- Support levels: $0.1200 and $0.8000
Disclaimer
The views and opinions stated by the author, or any people named in this article, are for informational purposes only. They do not establish financial, investment, or other advice. Investing in or trading crypto assets comes with a risk of financial loss.
Steve Anderson is an Australian crypto enthusiast. He is a specialist in management and trading for over 5 years. Steve has worked as a crypto trader, he loves learning about decentralisation, understanding the true potential of the blockchain.


