
 Home
Home News
News

- 1 BTC price is consolidating in a narrow range below $30k.
- 2 Buyers are attempting to escape the cage but have not succeeded yet.
Bitcoin (BTC) price chart shows efforts to surpass $30k, which is a strong barrier buyers faced in the past session. BTC price is hovering below it, with low volume indicating low interest in the last session. The price action indicates that BTC is trading near the 50-day EMA, and buyers are facing pressure from the bears who decisively prevented the range.

The chart shows that BTC has been trading in an uptrend in the past months and climbing the stairs decisively. Furthermore, the lower trendline was also respected and took multiple bounce-backs, as shown on the charts. However, making a head and shoulders pattern also suggests a bearish sentiment for the upcoming sessions if the price slips below the lower trendline below the 200-day EMA.
However, the BTC price only retraced a little from the top. It consolidates near $30K, which indicates that buyers are willing to retest the highs and put in efforts, but failed due to the aggressive sellers who maintained a firm grip and prevented the range from surpassing it. Buyers persisted in holding the gains near $29K but faced selling pressure resulting in a gradual decline forming lower lows in the last sessions.
At press time, Bitcoin (BTC) price is trading at $29060.57 with an intraday drop of 0.58% showing neutral indications. Moreover, the trading volume increased by 1.90% to $9.26 Billion. However, the market capitalization of BTC is $564.68 Billion. The intraday high of BTC is $29,274.83, and the intraday low is $28,945.88 showing selling pressure from the top.
BTC Price Action On Daily Charts

On the daily charts, BTC price stayed near the 50-day EMA and hovered below $30K, just around $29800. Moreover, the price action indicates that sellers have attained momentum, whereas buyers are losing their strength.
As per the Fib levels, BTC price is trading above 50%, trying to surpass 61.8% at $29600, and facing rejection from it in the past sessions. However, the price is near the lower bollinger band, and the band is squeezing, indicating that a decisive move is about to happen.
What Technical Indicators Say?
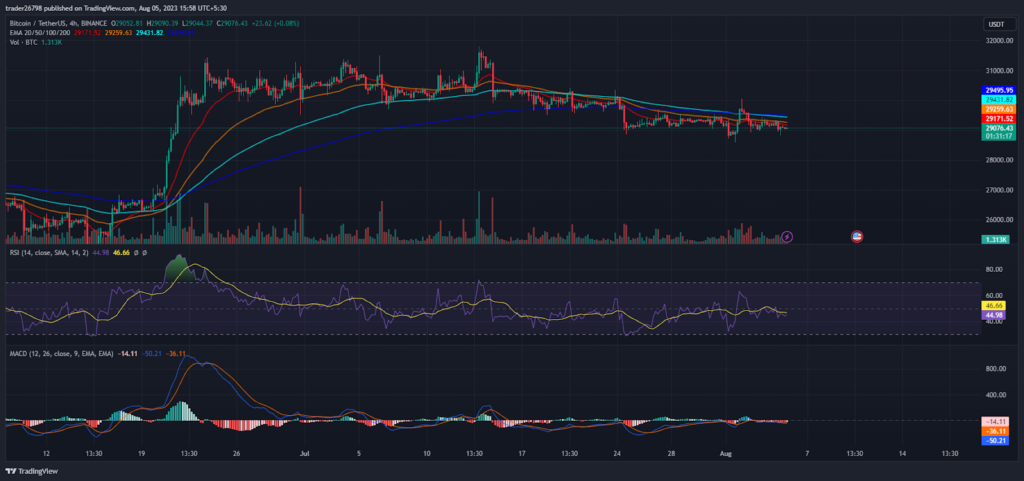
On the 4-hour charts, BTC price stayed in a narrow range and consolidated over the past few sessions. Moreover, the chart shows lower lows sequences which showed retracement from the highs and price heads to find decisive support where a bounce arises.
The RSI curve stayed near 52 and showed neutrality on the charts indicating the lower interest of investors.
Similarly, the MACD indicator showed convergence of the moving averages and indicated neutrality suggesting upcoming volatile moves.
Conclusion
Bitcoin (BTC) price shows consolidation and stayed in a narrow range hovering below the hurdle of $30K for the past sessions. Moreover, the price action favoring the sellers indicates that the price is heading toward the 200-day EMA to find strong support.
Technical Levels:
Support Levels: $28600 and $28000
Resistance Levels: $30350 and $31000
Disclaimer
The views and opinions stated by the author, or any people named in this article, are for informational purposes only and do not establish financial, investment, or other advice. Investing in or trading crypto assets comes with a risk of financial loss.

With a background in journalism, Ritika Sharma has worked with many reputed media firms focusing on general news such as politics and crime. She joined The Coin Republic as a reporter for crypto, and found a great passion for cryptocurrency, Web3, NFTs and other digital assets. She spends a lot of time researching and delving deeper into these concepts around the clock, and is a strong advocate for women in STEM.


