
 Home
Home News
News
- 1 CIVI stock price is currently trading at $75.61 (press time) with a rise of 4.43% in the last 24 hours.
- 2 Civitas has a current market cap of $7.089 Billion.
CIVI Stock is a company that explores and produces oil and gas in the Rocky Mountains area, mainly in the Wattenberg Field of the Denver-Julesburg Basin in Colorado. The company was created in May 2021 by merging Bonanza Creek Energy and Extraction Oil & Gas. The company aims to grow its business, protect the environment, and reward its shareholders.
Technical Analysis of CIVI Stock Price in 1-D Timeframe
Civitas ( NYSE: CIVI) has seen its stock price rise steadily for the past six months, gaining more than 20%. When writing, Civitas stock was trading at $75.61 and had been trying to hold on to this level after a pullback.
If it can keep this level, the CIVI price could continue to increase and reach the first and second targets of $80.00 and $85.00. However, if the Civitas price cannot maintain this level and falls, it might hit the closest support levels of $65.00 and $60.00.
Currently, CIVI stock is trading above the 50 and 200-day SMAs (simple moving averages), supporting the price trend.
However, if buying volume increases, the price might conquer supporting SMAs by making higher highs. Hence, the Civitas price is expected to move upward, giving bullish views over the daily time frame chart.
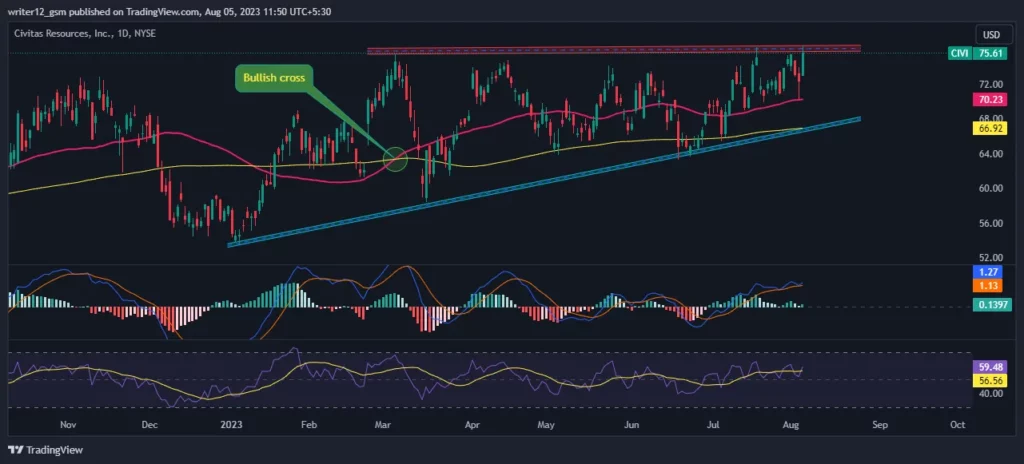
The current value of RSI is 59.48 points. The 14 SMA is above the median line at 56.56 points, indicating that the CIVI stock is bearish.
The MACD line at 1.27 and the signal line at 1.13 are above zero. A bullish crossover is observed in the MACD indicator, which signals more bullishness for the Civitas stock price.
Summary
Civitas (NYSE: CIVI) suggests that the investors and traders of the share price are bullish on the 1-D time frame. The price action reflects a bullish perspective at the moment. The technical oscillators of the Civi stock price also support the bullish trend. The MACD, RSI, and EMA emphasize positive signs and imply that the uptrend may continue in the Civitas stock price.
Technical Levels
- Support Levels: $65.00 and $60.00.
- Resistance Levels: $80.00 and $85.00.
Disclaimer
The analysis provided in this article is for informational and educational purposes only. Do not rely on this information as financial, investment, or trading advice. Investing and trading in stock involves risk. Please assess your situation and risk tolerance before making any investment decisions.

Andrew is a blockchain developer who developed his interest in cryptocurrencies while pursuing his post-graduation major in blockchain development. He is a keen observer of details and shares his passion for writing, along with coding. His backend knowledge about blockchain helps him give a unique perspective to his writing skills, and a reliable craft at explaining the concepts such as blockchain programming, languages and token minting. He also frequently shares technical details and performance indicators of ICOs and IDOs.


