


Unity Software Inc. (NYSE: U) is a company that offers a platform for creating and operating interactive, real-time 3D content. U stock is traded on the NYSE and has a market value of $15.403 Billion as of August 8, 2023. The stock’s price fluctuated between $21.22 and $58.62 in the past year, and it does not have a PE ratio or a dividend yield.
Technical Analysis of Unity Software Stock Price in 1-D Timeframe
Unity Software (NYSE: U) has seen its stock price rise steadily for the past three months, gaining 60%. At the time of writing, U stock is trading at $40.17 and has been trying to hold on to this level after a pullback.
If it can keep this level, the Unity Software price could continue to increase and reach the first and second targets of $50.00 and $60.00. However, if the U price cannot maintain this level and it falls, then it might hit the closest support levels of $38.50 and $32.50
At the time of publishing, Unity Software stock (NYSE: U) trades above the 50 and 200-day SMAs (Simple moving averages), supporting the price trend.
However, if selling volume adds up, then the price might conquer supporting SMAs by making lower highs and lows. Hence, the U price is expected to move downwards, giving bearish views over the daily time frame chart.
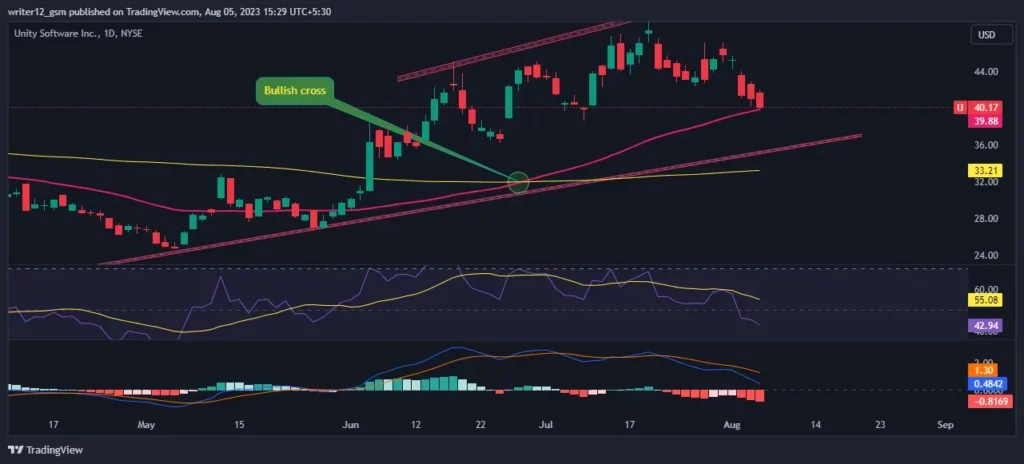
The current value of RSI is 42.94 points. The 14 SMA is above the median line at 55.08 points, indicating that the Unity Software stock is bullish.
The MACD line at 0.4842 and the signal line at 9.35 are above the zero line. A bearish crossover in the MACD indicator signals more bullishness for the U stock price.
Summary
Unity Software (NYSE: U) suggests that the investors and traders are bullish on the 1-D time frame. The price action reflects a bullish perspective at the moment. The technical oscillators of the U stock price also support the bullish trend. The MACD, RSI, and EMA emphasize positive signs and imply that the downtrend may continue in the U stock price.
Technical Levels
- Support Levels: $38.50 and $32.50.
- Resistance levels: $50.00 and $60.00.


