
 Home
Home News
News
- 1 Arbitrum crypto price is currently trading at $1.1378 with a rise of 1.15% in the last 24 hours.
- 2 ARB has a current market cap of $1.1378 Million.
Arbitrum’s native token is called ARB and is used for governance. Arbitrum has an ambitious roadmap for 2023, which includes launching its own layer three solutions called Orbit and enabling developers to deploy programs written in popular programming languages like Rust, C++, and others.
Technical Analysis of Arbitrum Crypto Price in 1-D Timeframe
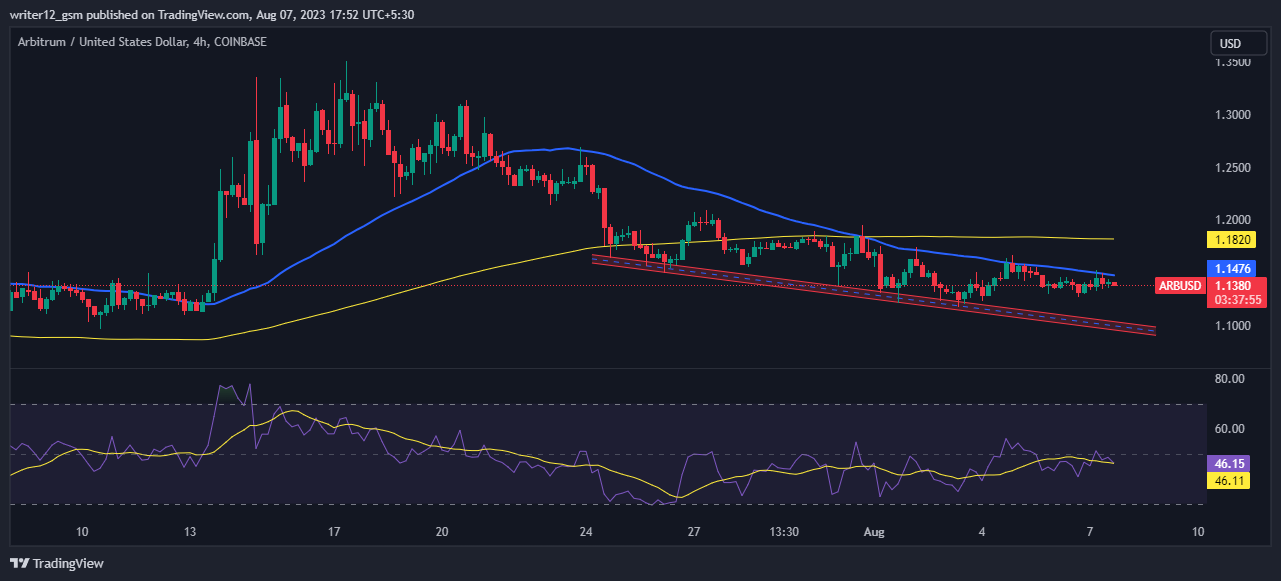
Arbitrum ( USD: ARB) has steadily seen its crypto price drop for the past six months, dropping -23.72%. At the time of writing, ARB crypto is trading at $1.1363 and has been trying to pull back from the current level.
If it can keep this level, the Arbitrum price could continue to go up and reach the first and second targets of $1.17 and $1.2076. However, if the ARB price cannot maintain this level and falls, then it might hit the closest support levels of $1.1193 and $1.0633.
At the time of publishing, Arbitrum crypto (USD: ARB) is trading above the 50 and 200-day SMAs (simple moving averages), which are supporting the price trend.
However, if selling volume adds up then the price might conquer supporting SMA’s by making lower highs and lows. Hence, the ARB price is expected to move downwards giving bearish views over the daily time frame chart.
The current value of RSI is 46.21 points. The 14 SMA is above the median line at 46.11 points which indicates that the Arbitrum crypto is bearish.
The MACD line at -0.0024 and the signal line at -0.0027 are above the zero line. A bearish crossover is observed in the MACD indicator which signals more bearishness for the ARB crypto price.
In the stochastic RSI, the %d line is at 64.53 and the %k line is at 64.19 points. The %d line clearly indicates that RSI is in the overbought zone on the other hand %k line shows negative sentiments regarding the price.
Summary
Arbitrum (USD: ARB) suggests that the investors and traders of the share price are bearish on the 1-D time frame. The price action reflects a bearish perspective at the moment. The technical oscillators of the ARB crypto price also support the bearish trend. The MACD, RSI, and SMA are emphasizing negative signs and imply that the downtrend may continue in the ARB crypto price.
Technical Levels
- Support Levels: The nearest support levels for the Arbitrum crypto price are $1.1193 and $1.0633.
- Resistance levels: The nearest resistance levels for the ARB crypto price are $1.17 and $1.2076.
Disclaimer
The analysis provided in this article is for informational and educational purposes only. Do not rely on this information as financial, investment, or trading advice. Investing and trading in crypto involves risk. Please assess your situation and risk tolerance before making any investment decisions.

Adarsh Singh is a true connoisseur of Defi and Blockchain technologies, who left his job at a “Big 4” multinational finance firm to pursue crypto and NFT trading full-time. He has a strong background in finance, with MBA from a prestigious B-school. He delves deep into these innovative fields, unraveling their intricacies. Uncovering hidden gems, be it coins, tokens or NFTs, is his expertise. NFTs drive deep interest for him, and his creative analysis of NFTs opens up engaging narratives. He strives to bring decentralized digital assets accessible to the masses.


