
 Home
Home News
News
- 1 ONEOK stock price is currently trading at $64.15 with a drop of 1.61% in the last 24 hours.
- 2 OKE has a current market cap of $28.718 Billion
ONEOK stock price has had a mixed performance over the year. Year-to-date, it gave negative returns of -2.27% and -7.14% in the span of 6 months. In the last 1 month, it gave a positive return of 5.68% and -3.97% in the last seven days indicating that the stock is in a long bearish trend. However, the bears have not given in yet.
Technical Analysis of ONEOK Stock Price in 1-D Timeframe
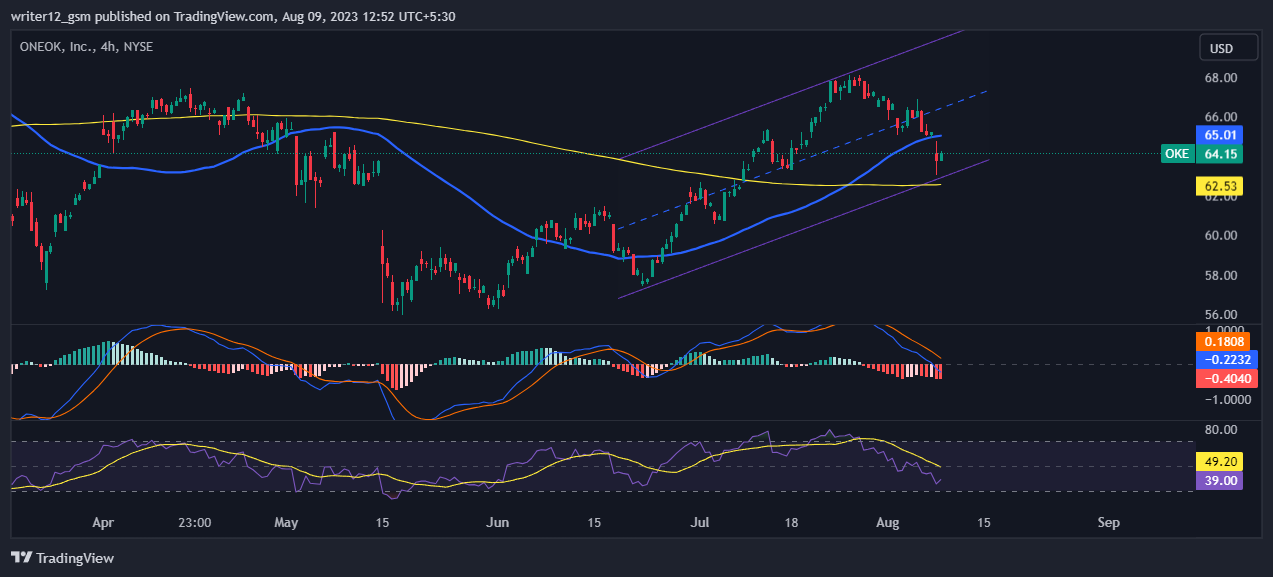
ONEOK (NYSE: OKE) has steadily seen its stock price drop in the past months. At the time of writing, OKE stock is trading at $64.15 and has been trying to hold on to this level after a pullback.

If it can keep this level, the ONEOK price could continue to go up and reach the target of $68.21. However, if the OKE price cannot maintain this level and it falls, then it might hit the closest support level of $61.44.
At the time of publishing, ONEOK stock (NYSE: OKE) is trading below the 50 and 200-day simple moving averages, which are weaknesses in price trends.
However, if selling volume adds up, then the price might conquer supporting SMAs by making lower highs and lows. Hence, the OKE price is expected to move downwards giving bearish views over the daily time frame chart.
The current value of RSI is 39.00 points. The 14 SMA is above the median line at 49.20 points which indicates that the ONEOK stock is bearish.
The MACD line at -0.2232 and the signal line at are below the zero line. A bearish crossover is observed in the MACD indicator which signals more bearishness for the OKE stock price.
Summary
ONEOK (NYSE: OKE) technical oscillators of the OKE stock price also support the bearish trend. The MACD, RSI, and EMA are emphasizing negative signs and imply that the downtrend may continue in the OKE stock price. It suggests that the investors and traders are bearish on the 1-D time frame. The price action reflects a bearish perspective at the moment.
Technical Levels
- Support Level: $68.21.
- Resistance Level: $61.44.
Disclaimer
The analysis provided in this article is for informational and educational purposes only. Do not rely on this information as financial, investment, or trading advice. Investing and trading in stock involves risk. Please assess your situation and risk tolerance before making any investment decisions.

Adarsh Singh is a true connoisseur of Defi and Blockchain technologies, who left his job at a “Big 4” multinational finance firm to pursue crypto and NFT trading full-time. He has a strong background in finance, with MBA from a prestigious B-school. He delves deep into these innovative fields, unraveling their intricacies. Uncovering hidden gems, be it coins, tokens or NFTs, is his expertise. NFTs drive deep interest for him, and his creative analysis of NFTs opens up engaging narratives. He strives to bring decentralized digital assets accessible to the masses.


