
 Home
Home News
News

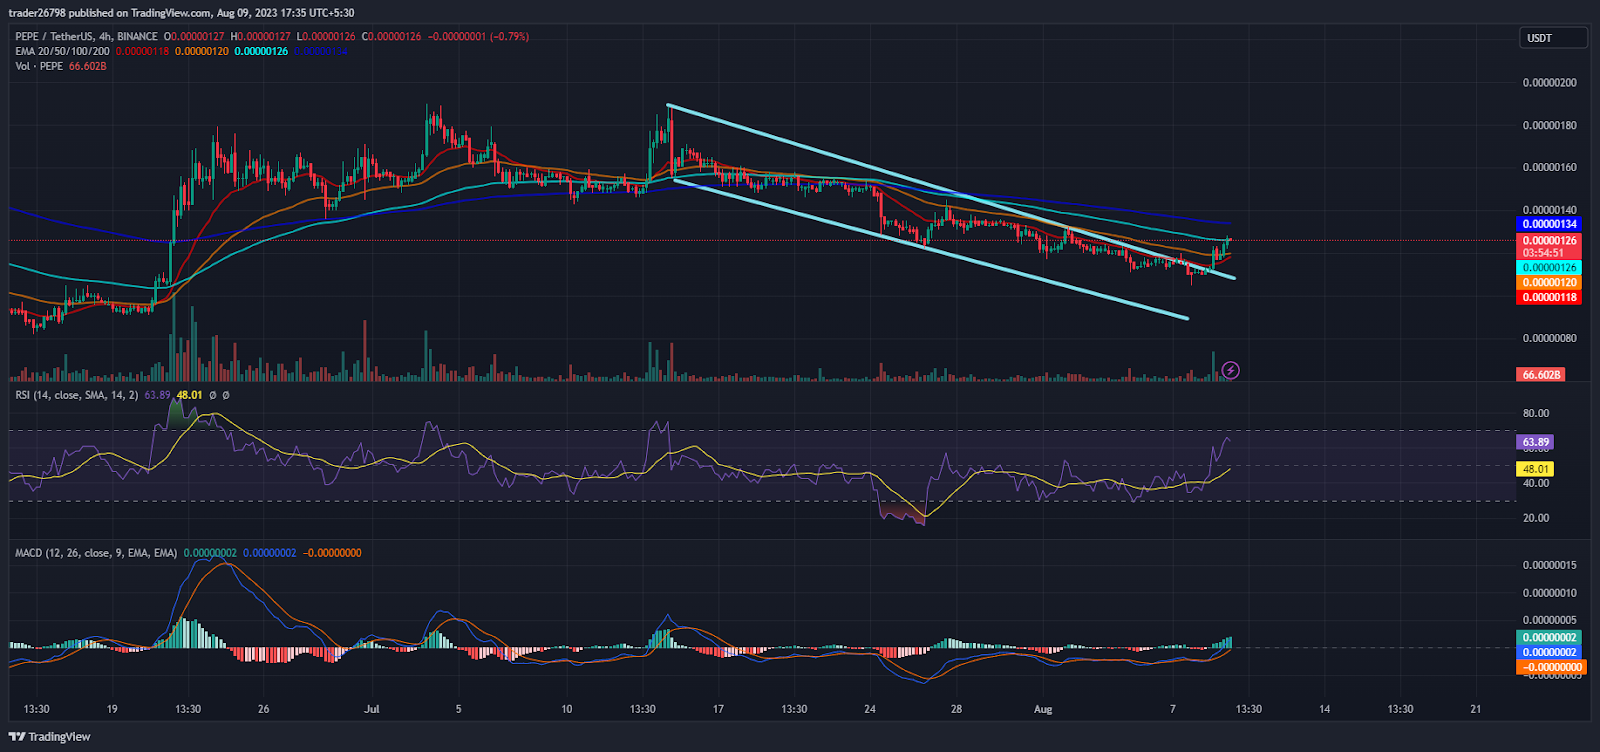
- 1 PEPE price shows channel breakout and is close to the 200-day EMA.
- 2 Buyers are gaining traction and surpassing the clusters decisively.
PEPE price rode the gains, breaking the trendline of the falling channel, initiating fresh buying moves on the charts. Moreover, the price action shows long buildup activity and demand among the investors who persisted in accumulating. PEPE forms a double bottom pattern and is revamped from the support of $0.000001000. Afterward, PEPE showed a one-way vertical rebound and did not look back, gaining massively.
The chart showcased a short covering move showing that sellers were trapped and in trouble due to the massive surge. Moreover, the price is close to the 200-day EMA, which, if surpassed, leads to an extension of the bull rally toward the swing of $0.000001500 for the upcoming sessions.

PEPE price entered the neutral zone from the selling region and showed a sharp and wild recovery from the support zone, suggesting that buyers are excited to retain the highs and look aggressive now. Furthermore, the price has surpassed the upper bollinger band and shows a breakout.
At press time, the PEPE price is trading at $0.000001262 with an intraday gain of 13% showing bullishness on the charts. Moreover, the trading volume surged by 38% to $259.80 Million. The market cap is $531.87 Billion.
However, the PEPE price faces the 100-day EMA barrier, and the price pauses near it on the hourly chart and waits for the breakout above it. Moreover, it is close to the distribution zone, which is also challenging for the bulls.
PEPE Price Action Shows Breakout On Short Term Charts
On the short-term charts, PEPE rode like a dark horse post-breakout of the channel and gained massively. Moreover, the volume spike indicates that massive demand for the memecoin increased among the investors.
Furthermore, apart from the other memecoins, PEPE was one of the top gainers and maintained the gains on the top in the intraday session.
As per the Fib levels, the PEPE price has surpassed the 38.2% and is close to neutrality. Moreover, it exceeded the upper bollinger band, which showed a breakout on the charts.
The RSI curve stayed in the overbought zone and formed a positive crossover indicating buyers’ traction on the charts.
The MACD indicator showed a bullish crossover, and the green bars on the histogram showed the buyers’ dominance suggesting a rise and extension of the rally in the following sessions.
Conclusion:
PEPE has broken the channel and is gaining massive momentum on the charts. The trajectory showcases that sellers were trapped, resulting in the gigantic short-covering rally, extending towards $0.000001400 in the following sessions.
Technical Levels:
Support Levels: $0.000001100 and $0.000001000
Resistance Levels: $0.000001300 and $0.000001500
Disclaimer
The views and opinions stated by the author, or any people named in this article, are for informational purposes only and do not establish financial, investment, or other advice. Investing in or trading crypto assets comes with a risk of financial loss.
Steve Anderson is an Australian crypto enthusiast. He is a specialist in management and trading for over 5 years. Steve has worked as a crypto trader, he loves learning about decentralisation, understanding the true potential of the blockchain.


